
1. Moving the Markets
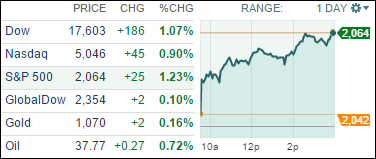
Again, jumping oil prices were the driving force behind today’s rally as the indexes managed to extend gains for the third day in a row almost wiping out the “post interest rate” losses of last week.
Global crude prices soared after inventory dropped an unexpected 5.9 million barrels last week reviving hope that the worst of this year’s oil debacle may be behind us, although I would not hold my breath. All 10 S&P sectors closed in the green again. Volume was low, and I would expect the same for tomorrow’s abbreviated session.
For the second day in a row, all of our 10 ETFs in the Spotlight rallied and closed on the plus side with the leader being the Mid-Cap Value ETF (IWS) at +1.90% while Consumer Staples (XLP) lagged with +0.73%.
2. ETFs in the Spotlight
In case you missed the announcement and description of this section, you can read it here again.
It features 10 broadly diversified ETFs from my HighVolume list as posted every Monday. Furthermore, they are screened for the lowest MaxDD% number meaning they have been showing better resistance to temporary sell offs than all others over the past year.
Here are the 10 candidates:
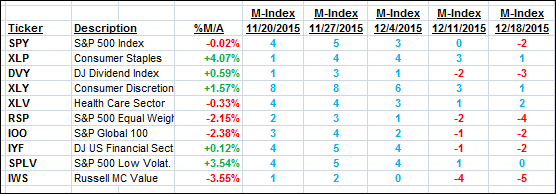
The above table simply demonstrates the magnitude with which some of the ETFs are fluctuating in regards to their positions above or below their respective individual trend lines (%M/A). A break below, represented by a negative number, shows weakness, while a break above, represented by a positive percentage, shows strength.
For hundreds of ETF/Mutual fund choices, be sure to reference Thursday’s StatSheet.
Year to date, here’s how the above candidates have fared so far:
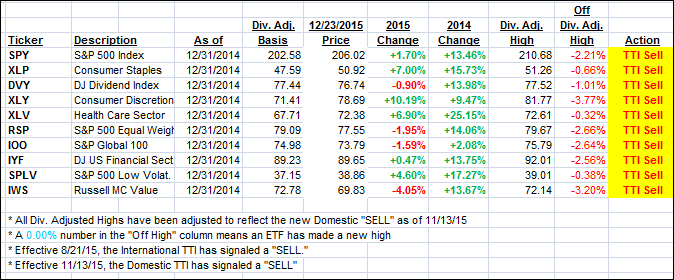
Again, the first table above shows the position of the various ETFs in relation to their respective long term trend lines (%M/A), while the second one tracks their trailing sell stops in the “Off High” column. The “Action” column will signal a “Sell” once the -7.5% point has been taken out in the “Off High” column.
3. Trend Tracking Indexes (TTIs)
Our Domestic Trend Tracking Index (TTI) moved higher as the indexes went into rally mode again. However, much more upside momentum is required to pull us out of our bearish position. After all, we’ve seen this type of low volume headfake before.
Here’s how we closed:
Domestic TTI: -0.38% (last close -0.79%)—Sell signal effective 11/13/2015
International TTI: -4.24% (last close -5.17%)—Sell signal effective 8/21/2015
Disclosure: I am obliged to inform you that I, as well as advisory clients of mine, own some of these listed ETFs. Furthermore, they do not represent a specific investment recommendation for you, they merely show which ETFs from the universe I track are falling within the guidelines specified.
Contact Ulli