
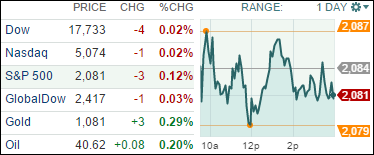
1. Moving the Markets
Of course, the potential interest rate hike remains on everyone’s mind as we head into 2016. However, whether or not the rate hike will take place still remains TBD but, more importantly, how will the markets react? Given the global economic landscape, I don’t think a hike is a given at this time, so we’ll have to linger in uncertainty for a while longer and watch our Domestic TTI for clues as to continued upward momentum and a potential new Buy signal.
In the meantime, we can focus on other aspects of the market. In tech today, mobile payments processing company Square (SQ) commenced their IPO and opened for trading at $11.20 a share, which was about $2 higher than $9 price that was expected throughout Wall Street.
In the food biz today, Keurig-Green Mountain (GMCR) gained after raising its quarterly dividend and putting forth some well-needed guidance heading into 2016. Though, the positive news overshadowed their weak Q4 numbers that showed sales slid 13% as demand weakened for its coffee potts and makers.
We also heard today that JM Smucker (SJM) gained after beating sales and earnings estimates. The food company reported a $40 increase in sales, which was mostly driven by its $3.2bil acquisition of Big Heart Pet Brands earlier this year.
Our 10 ETFs in the Spotlight were mixed with 6 of them closing up, led by the Global 100 (IOO) with +0.33%; 4 of them ended up lower led by Healthcare (XLV), which got clobbered -1.68%.
2. ETFs in the Spotlight
In case you missed the announcement and description of this section, you can read it here again.
It features 10 broadly diversified ETFs from my HighVolume list as posted every Monday. Furthermore, they are screened for the lowest MaxDD% number meaning they have been showing better resistance to temporary sell offs than all others over the past year.
Here are the 10 candidates:
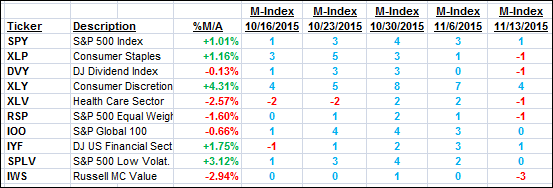
The above table simply demonstrates the magnitude with which some of the ETFs are fluctuating in regards to their positions above or below their respective individual trend lines (%M/A). A break below, represented by a negative number, shows weakness, while a break above, represented by a positive percentage, shows strength.
For hundreds of ETF/Mutual fund choices, be sure to reference Thursday’s StatSheet.
Year to date, here’s how the above candidates have fared so far:
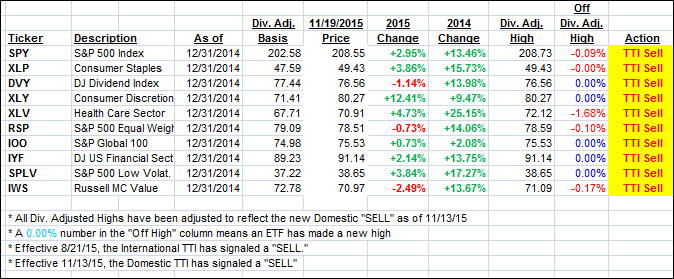
Again, the first table above shows the position of the various ETFs in relation to their respective long term trend lines (%M/A), while the second one tracks their trailing sell stops in the “Off High” column. The “Action” column will signal a “Sell” once the -7.5% point has been taken out in the “Off High” column.
3. Trend Tracking Indexes (TTIs)
Our Domestic Trend Tracking Index (TTI) remained almost unchanged and we will wait for more upside momentum to develop before getting involved in a new Buy cycle. Stay tuned for the latest updates.
Here’s how we ended this day:
Domestic TTI: +0.26% (last close +0.25%)—Sell signal effective 11/13/2015
International TTI: -3.26% (last close -3.42%)—Sell signal effective 8/21/2015
Disclosure: I am obliged to inform you that I, as well as advisory clients of mine, own some of these listed ETFs. Furthermore, they do not represent a specific investment recommendation for you, they merely show which ETFs from the universe I track are falling within the guidelines specified.
Contact Ulli