
1. Moving the Markets
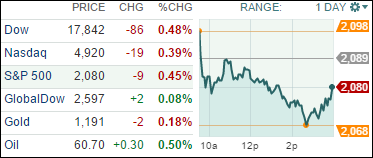
Stocks pared back early gains to close in the red across the board. Rising interest rates and oil prices appeared to be the culprits today.
Oil dragged markets lower today as prices jumped above $61 a barrel. The U.S. benchmark rose 2.1% to $61.65 on the New York Mercantile Exchange, as concerns about rising demand and easing supply stoked the recent rally in crude prices.
Interest rates here in the U.S. continued their steady climb of late. The yield on the benchmark U.S. 10-year Treasury note was at 2.24%, up from 2.18% on Tuesday, following a global trend of surging yields. Investors continue to listen closely to commentary from Fed policy makers and watch economic data for clues on the timing of future interest-rate increases.
The latest update on the jobs front did not add any confidence to market concerns today. Payroll processor ADP said today that businesses added just 169,000 jobs in April. Economists had expected 198,000 new jobs. The jobs trend has been on a downward move since November 2014.
And in earnings news, Tesla (TSLA) reported losing $45 million last quarter, but that was less than expected. Shares subsequently rose in after-hours trading. Besides its electric cars, Tesla announced last week that it is also going to venture into home and business battery units.
9 of our 10 ETFs in the Spotlight closed lower with only Consumer Staples (XLP) bucking the trend by gaining 0.31%. Leading the downside were the Financials (IYF) with a loss of 0.46%.
2. ETFs in the Spotlight
In case you missed the announcement and description of this section, you can read it here again.
It features 10 broadly diversified ETFs from my HighVolume list as posted every Monday. Furthermore, they are screened for the lowest MaxDD% number meaning they have been showing better resistance to temporary sell offs than all others over the past year.
Here are the 10 candidates:
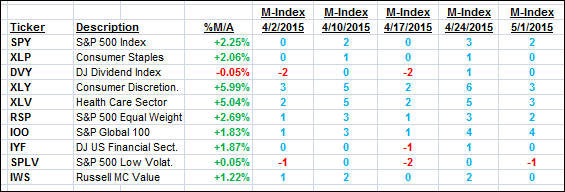
The above table simply demonstrates the magnitude with which some of the ETFs are fluctuating in regards to their positions above or below their respective individual trend lines (%M/A). A break below, represented by a negative number, shows weakness, while a break above, represented by a positive percentage, shows strength.
For hundreds of ETF/Mutual fund choices, be sure to reference Thursday’s StatSheet.
Year to date, here’s how the above candidates have fared so far:
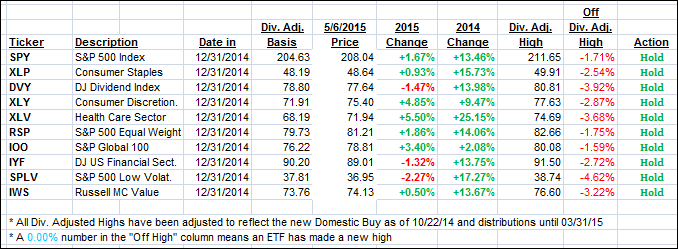
Again, the first table above shows the position of the various ETFs in relation to their respective long term trend lines (%M/A), while the second one tracks their trailing sell stops in the “Off High” column. The “Action” column will signal a “Sell” once the -7.5% point has been taken out in the “Off High” column.
3. Trend Tracking Indexes (TTIs)
Our Trend Tracking Indexes (TTIs) closed mixed but remain in bullish territory by the following percentages:
Domestic TTI: +1.84% (last close +2.00%)—Buy signal effective 10/22/2014
International TTI: +4.03% (last close +3.98%)—Buy signal effective 2/13/2015
Disclosure: I am obliged to inform you that I, as well as advisory clients of mine, own some of these listed ETFs. Furthermore, they do not represent a specific investment recommendation for you, they merely show which ETFs from the universe I track are falling within the guidelines specified.
Contact Ulli
Comments 2
Is VEU a good proxy for your international indicator, or do you prefer IOO?
Chuck,
I prefer IOO over VEU due to its lesser volatility. Please see my Reader Q&A in tomorrow’s mailing.
Ulli…