
1. Moving the Markets
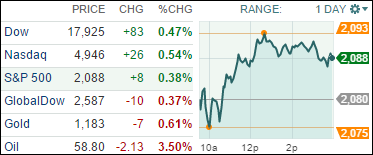
Stocks gained today with the Dow climbing 82 points as investors shook off growing concerns about overvalued stocks and rising interest rates.
Markets broke a 2-day losing streak; however, the mood remained cautious after comments by Janet Yellen Wednesday that suggested stocks are generally overvalued. Lady Yellen said market valuations were generally “quite high” in response to a question about risks to financial stability at a conference.
Alibaba (BABA) was all over the news today. Shares gained 7.5% as the Chinese Internet giant reported earnings that toppled Wall Street expectations and noted a strategic HR move, of which entails that the COO Daniel Zhang will become the new CEO. Yahoo (YHOO), who owns about 15% of the Chinese Internet firm, also got a boost as shares jumped 5.2%.
And finally, online review site Yelp (YELP) saw a massive gain of 23% today, mostly based on a report that the company was exploring a sale. Wanna buy? Yelp could net more than $3.5 billion in a strategic sale, says a report from WSJ. Until then, keep yelping your favorite restaurants and hot spots.
9 of our 10 ETFs in the Spotlight closed up as the indexes managed to establish some upside momentum. Leading the charge were the Financials (IYF) with a gain of 0.75%, while The Global 100 (IOO) was the lone loser with -0.14%.
2. ETFs in the Spotlight
In case you missed the announcement and description of this section, you can read it here again.
It features 10 broadly diversified ETFs from my HighVolume list as posted every Monday. Furthermore, they are screened for the lowest MaxDD% number meaning they have been showing better resistance to temporary sell offs than all others over the past year.
Here are the 10 candidates:
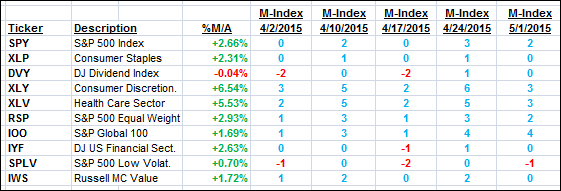
The above table simply demonstrates the magnitude with which some of the ETFs are fluctuating in regards to their positions above or below their respective individual trend lines (%M/A). A break below, represented by a negative number, shows weakness, while a break above, represented by a positive percentage, shows strength.
For hundreds of ETF/Mutual fund choices, be sure to reference Thursday’s StatSheet.
Year to date, here’s how the above candidates have fared so far:
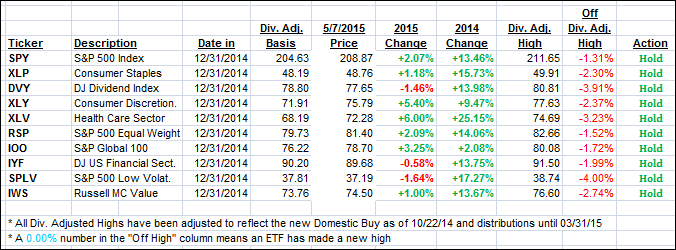
Again, the first table above shows the position of the various ETFs in relation to their respective long term trend lines (%M/A), while the second one tracks their trailing sell stops in the “Off High” column. The “Action” column will signal a “Sell” once the -7.5% point has been taken out in the “Off High” column.
3. Trend Tracking Indexes (TTIs)
Our Trend Tracking Indexes (TTIs) recovered and closed higher.
Here’s how we ended up:
Domestic TTI: +2.05% (last close +1.84%)—Buy signal effective 10/22/2014
International TTI: +3.95% (last close +4.03%)—Buy signal effective 2/13/2015
Disclosure: I am obliged to inform you that I, as well as advisory clients of mine, own some of these listed ETFs. Furthermore, they do not represent a specific investment recommendation for you, they merely show which ETFs from the universe I track are falling within the guidelines specified.
Contact Ulli