
1. Moving the Markets
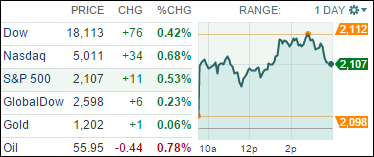
Netflix (NFLX) was all over the news today. The stock surged more than 12% today after the public welcomed earnings news that the company’s revenue jumped 24% and membership surpassed 60 million global users. The Nasdaq composite index reacted accordingly, jumping back above the 5000 mark for the day to close at 5011. The tech-heavy index is about 15 points away from its 2015 closing high of 5026.42 and is 37 points from its all-time closing high of 5048.62 set on March 10, 2000.
While there was a lot of buzz about tech stocks today, it was energy stocks that led the pack again as oil prices rose for a fourth straight day. Benchmark U.S. crude surged nearly 6% to close at $56.39 a barrel in New York.
Other notable earnings news: Delta Airlines (DAL) posted a first quarter profit of $746 million, or 90 cents per share. Intel (INTC) shares surged 4.3% after reporting earnings that met analysts’ expectations. And Bank of America (BAC) said first-quarter results were dampened slightly due to lower interest rates on its debt portfolios. Charlotte-based BAC was off 1.1%.
Lastly, a bit of interesting M&A news. How often have you used your Segway of late? Well, if you don’t have one, it is no surprise. The iconic maker of self-balancing personal electric scooters has been struggling recently and it was announced today that the company has been bought by a Chinese rival, Ninebot.
8 of our 10 ETFs in the Spotlight joined the rally, which was led by RSP with a 0.62% gain. On the downside, XLP slipped 0.28%. RSP and IOO made new highs for the year as the table in section 3 shows.
2. ETFs in the Spotlight
In case you missed the announcement and description of this section, you can read it here again.
It features 10 broadly diversified ETFs from my HighVolume list as posted every Monday. Furthermore, they are screened for the lowest MaxDD% number meaning they have been showing better resistance to temporary sell offs than all others over the past year.
Here are the 10 candidates:
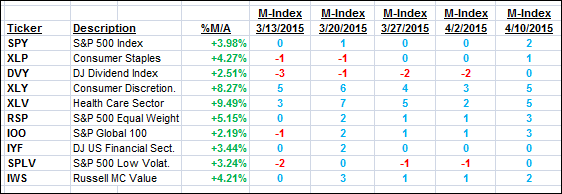
The above table simply demonstrates the magnitude with which some of the ETFs are fluctuating in regards to their positions above or below their respective individual trend lines (%M/A). A break below, represented by a negative number, shows weakness, while a break above, represented by a positive percentage, shows strength.
For hundreds of ETF/Mutual fund choices, be sure to reference Thursday’s StatSheet.
Year to date, here’s how the above candidates have fared so far:
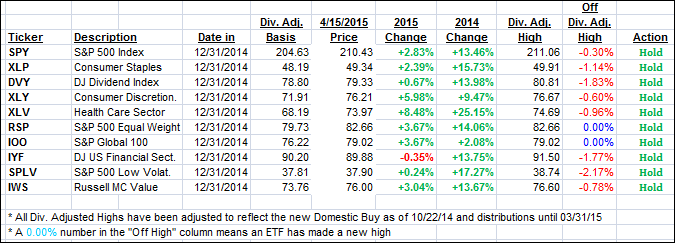
Again, the first table above shows the position of the various ETFs in relation to their respective long term trend lines (%M/A), while the second one tracks their trailing sell stops in the “Off High” column. The “Action” column will signal a “Sell” once the -7.5% point has been taken out in the “Off High” column.
3. Trend Tracking Indexes (TTIs)
Our Trend Tracking Indexes (TTIs) joined upward momentum and showed some nice gains, especially on the international side:
Here’s how we ended up:
Domestic TTI: +3.56% (last close +3.27%)—Buy signal effective 10/22/2014
International TTI: +5.31% (last close +4.78%)—Buy signal effective 2/13/2015
Disclosure: I am obliged to inform you that I, as well as advisory clients of mine, own some of these listed ETFs. Furthermore, they do not represent a specific investment recommendation for you, they merely show which ETFs from the universe I track are falling within the guidelines specified.
Contact Ulli
Comments 2
since xlv has been a top performing index fund for many years why
not consider CURE?
Norman,
The time to use a 3X leveraged fund like CURE would have been at the beginning of the cycle and not this far into it. However, if your risk tolerance allows such leverage, then by all means go for it. I prefer the slow and steady approach.
Ulli…