
1. Moving the Markets
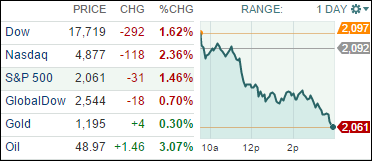
As the headline suggested, it was a tough day for all the major indexes. It was a third straight day of losses, and we saw the Dow drop a lofty 293 points by the close of trading. Are you hungry to know who the culprit was of the bearish trading session? None other than two food giants: Heinz (HNZ) and Kraft (KRFT).
The “MegaDeal”, as many are calling it, has investors all in a tussle it seems. The acquisition price, a mere $46 billion, will create the third largest Food and Beverage Company in North America. Not something to squint your eyes at by any means. Mr. Buffet has had a smile on his face thus far in 2015, given the fact that Berkshire Hathaway (BRK) owned 192,666 shares of Kraft at year end 2014, with a market value of $12.1 million. The stock price, as of today, puts BRK’s holdings at $16.2 million, which entails a 14% gain so far this year.
Moving on to commodities, the price of oil settled up 3% today as a weak dollar, fighting in Yemen and speculative buying boosted crude prices in spite of U.S. inventories building to record highs for an 11th week. In no help of the black gold price, the USD fell after disappointing U.S. durable goods orders for February came in. As we all know, a weaker dollar makes commodities denominated in the greenback cheaper for holders of other currencies typically boosting demand for such raw materials.
All of our 10 ETFs in the Spotlight followed the path down with the financials (IYF) taking the lead sporting a -1.88% loss, while Consumer Staples (XLP) resisted the sell-off very well by only surrendering -0.25%.
2. ETFs in the Spotlight
In case you missed the announcement and description of this section, you can read it here again.
It features 10 broadly diversified ETFs from my HighVolume list as posted every Monday. Furthermore, they are screened for the lowest MaxDD% number meaning they have been showing better resistance to temporary sell offs than all others over the past year.
Here are the 10 candidates:
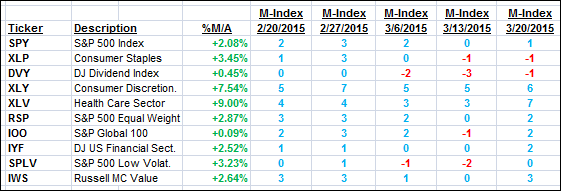
The above table simply demonstrates the magnitude with which some of the ETFs are fluctuating in regards to their positions above or below their respective individual trend lines (%M/A). A break below, represented by a negative number, shows weakness, while a break above, represented by a positive percentage, shows strength.
For hundreds of ETF/Mutual fund choices, be sure to reference Thursday’s StatSheet.
Year to date, here’s how the above candidates have fared so far:
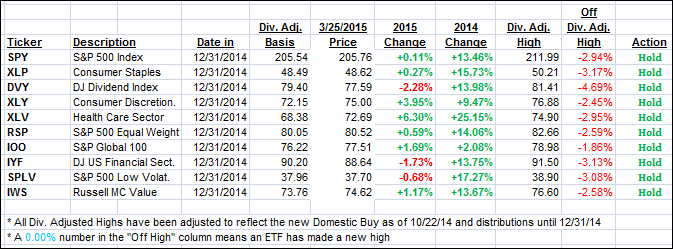
Again, the first table above shows the position of the various ETFs in relation to their respective long term trend lines (%M/A), while the second one tracks their trailing sell stops in the “Off High” column. The “Action” column will signal a “Sell” once the -7.5% point has been taken out in the “Off High” column.
3. Trend Tracking Indexes (TTIs)
Our Trend Tracking Indexes (TTIs) pulled back following the lack of upside momentum but are remaining on the bullish side of their respective trend lines.
Here’s how we ended up on this slippery day:
Domestic TTI: +2.94% (last close +3.81%)—Buy signal effective 10/22/2014
International TTI: +4.02% (last close +4.83%)—Buy signal effective 2/13/2015
Disclosure: I am obliged to inform you that I, as well as advisory clients of mine, own some of these listed ETFs. Furthermore, they do not represent a specific investment recommendation for you, they merely show which ETFs from the universe I track are falling within the guidelines specified.
Contact Ulli