
1. Moving the Markets
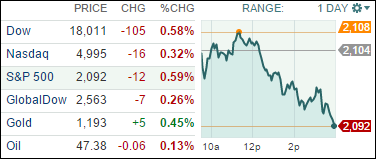
Stocks drifted in and out of positive territory most of the morning, but turned downwards in afternoon trading as investors digested economic reports that showed an uptick in inflation and a big jump in new-home sales in February. Before the closing bell, the Labor Department reported that consumer prices were up 0.2%, the first increase in four months and in line with the rise expected by economists. Core prices, excluding food and energy, were up 0.2%.
In a second report, the government also said new-home sales climbed 7.8% to a seasonally adjusted annual rate of 539,000. The announcement came after an upward revision to January’s sales rate to 500,000 from a 481,000 annual rate.
Google (GOOG) jumped 2.2% Tuesday after saying it hired Ruth Porat, Morgan Stanley’s CFO, to replace Patrick Pichette as its the CFO in May. In entertainment, Netflix (NFLX) rose 3.1%, which is the largest gain since Feb. 3.
And in auto news, Ford Motors (F) is on track to move into the fourth place among foreign automakers in factory capacity in the country. Ford recently opened a new plant in Hangzhou that will increase the company’s manufacturing capacity to approximately 1.2 million vehicles a year.
All of our 10 ETFs in the Spotlight headed south lead by DVY and XLV with -0.87%, while IOO held up best by only surrendering -0.38%.
2. ETFs in the Spotlight
In case you missed the announcement and description of this section, you can read it here again.
It features 10 broadly diversified ETFs from my HighVolume list as posted every Monday. Furthermore, they are screened for the lowest MaxDD% number meaning they have been showing better resistance to temporary sell offs than all others over the past year.
Here are the 10 candidates:
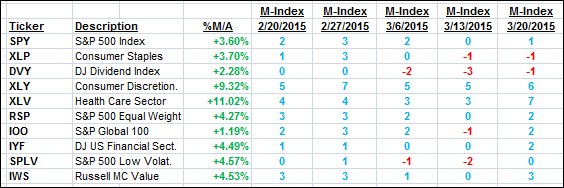
The above table simply demonstrates the magnitude with which some of the ETFs are fluctuating in regards to their positions above or below their respective individual trend lines (%M/A). A break below, represented by a negative number, shows weakness, while a break above, represented by a positive percentage, shows strength.
For hundreds of ETF/Mutual fund choices, be sure to reference Thursday’s StatSheet.
Year to date, here’s how the above candidates have fared so far:
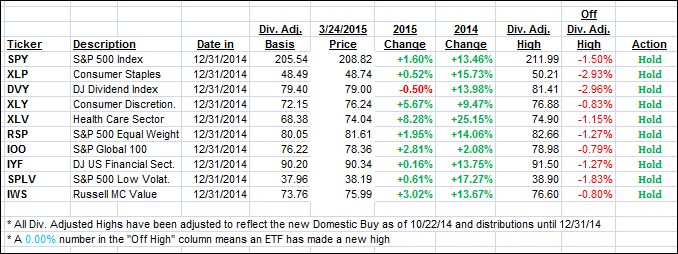
Again, the first table above shows the position of the various ETFs in relation to their respective long term trend lines (%M/A), while the second one tracks their trailing sell stops in the “Off High” column. The “Action” column will signal a “Sell” once the -7.5% point has been taken out in the “Off High” column.
3. Trend Tracking Indexes (TTIs)
Our Trend Tracking Indexes (TTIs) slipped slightly but are maintaining their bullish position.
Here’s how we closed:
Domestic TTI: +3.81% (last close +3.98%)—Buy signal effective 10/22/2014
International TTI: +4.83% (last close +5.10%)—Buy signal effective 2/13/2015
Disclosure: I am obliged to inform you that I, as well as advisory clients of mine, own some of these listed ETFs. Furthermore, they do not represent a specific investment recommendation for you, they merely show which ETFs from the universe I track are falling within the guidelines specified.
Contact Ulli