
1. Moving the Markets
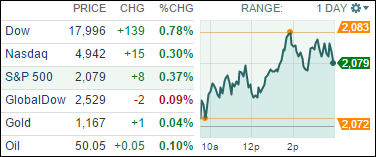
All major indexes closed higher to kick off the week of March 9th, apparently bullish on some tech stocks, Apple (AAPL) in particular. More details came out today on Apple’s newest gadget – The Apple Watch. Apple is looking to extend its dominance on mobile devices with the new gadget which Cook called “the most advanced timepiece ever created.”
It was previously announced that the “smartwatch”, which is the company’s first big rollout since the iPad, will go on sale in April, with three editions starting at $350. It was also revealed today that an 18-karat gold version will be available, starting at a meager price of $10,000.
In auto news, General Motors (GM) announced this morning that it will repurchase $5 billion in shares by the end of 2016, to begin immediately. Alongside the buyback, Harry Wilson will withdraw his candidacy from the GM board of directors.
And in M&A news, metals manufacturing giant Alcoa Inc. (AA) announced today that they plan on buying RTI International Metals (RTI) for a proposed $1.5 billion. The acquisition marks a strategic move from Alcoa to increase its presence in the aerospace business, a company representative said.
All of our 10 ETFs in the Spotlight followed the rebound to higher levels and closed up. Leading the charge today was healthcare (XLV) with a gain of +0.62%.
2. ETFs in the Spotlight
In case you missed the announcement and description of this section, you can read it here again.
It features 10 broadly diversified ETFs from my HighVolume list as posted every Monday. Furthermore, they are screened for the lowest MaxDD% number meaning they have been showing better resistance to temporary sell offs than all others over the past year.
Here are the 10 candidates:
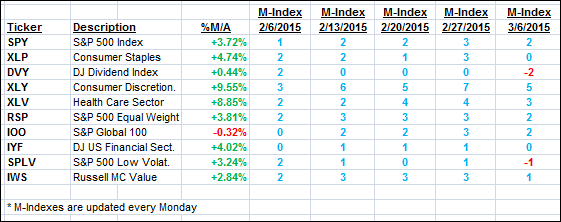
The above table simply demonstrates the magnitude with which some of the ETFs are fluctuating in regards to their positions above or below their respective individual trend lines (%M/A). A break below, represented by a negative number, shows weakness, while a break above, represented by a positive percentage, shows strength.
For hundreds of ETF/Mutual fund choices, be sure to reference Thursday’s StatSheet.
Year to date, here’s how the above candidates have fared so far:
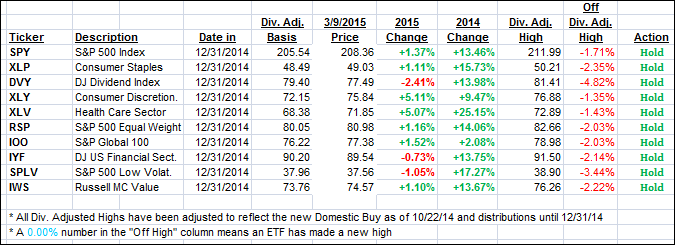
Again, the first table above shows the position of the various ETFs in relation to their respective long term trend lines (%M/A), while the second one tracks their trailing sell stops in the “Off High” column. The “Action” column will signal a “Sell” once the -7.5% point has been taken out in the “Off High” column.
3. Trend Tracking Indexes (TTIs)
Our Trend Tracking Indexes (TTIs) were mixed with the domestic one gaining and the international one slipping a tad.
Here’s how we this day ended:
Domestic TTI: +3.03% (last close +2.74%)—Buy signal effective 10/22/2014
International TTI: +2.91% (last close +2.98%)—Buy signal effective 2/13/2015
Disclosure: I am obliged to inform you that I, as well as advisory clients of mine, own some of these listed ETFs. Furthermore, they do not represent a specific investment recommendation for you, they merely show which ETFs from the universe I track are falling within the guidelines specified.
Contact Ulli