
1. Moving the Markets
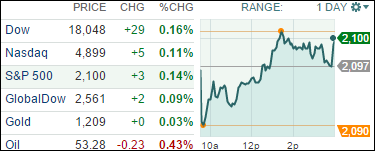
Stocks began the day in the red, but all major indexes climbed back to close in positive territory. The big news of the day was that S&P 500 conquered 2,100 for the first time, another record closing. One of the primary drivers behind market gains today was the news that Greece will request an extension of its current bailout agreement with its creditors. It appears Wall Street is not betting on a Greek Debt Tragedy after all, despite last-minute talks between Greece’s new government and its creditors over bailout terms. Greece’s current loan deal expires at the end of the month and its future in the eurozone is at stake as is its pipeline to much-needed funds from eurozone lenders.
In tech, Apple (AAPL) hit another record high today; however, some analysts seem to feel there may be a resistance level around the $135/share mark. According to S&P Capital IQ, Shares of Apple are now trading for 17.2 times its diluted earnings per share over the past year; that’s very close to the 18x valuation which has been a problem for the stock twice before.
In the commodities world, Gold dropped 1.8% to $1,209.25 an ounce on the spot market, amid speculation Chinese demand will retreat during the Chinese New Year holiday. Silver tumbled 4.5%, and platinum dropped to the cheapest level in more than five years. Nickel and Zinc for three-month delivery in London sank more than 2%. Oil prices rose as U.S. benchmark crude gained 84 cents to $53.59 per barrel.
9 our 10 ETFs in the Spotlight closed up with 4 of them making new highs; all of them are now on the plus side YTD.
2. ETFs in the Spotlight
In case you missed the announcement and description of this section, you can read it here again.
It features 10 broadly diversified ETFs from my HighVolume list as posted every Monday. Furthermore, they are screened for the lowest MaxDD% number meaning they have been showing better resistance to temporary sell offs than all others over the past year.
Here are the 10 candidates:
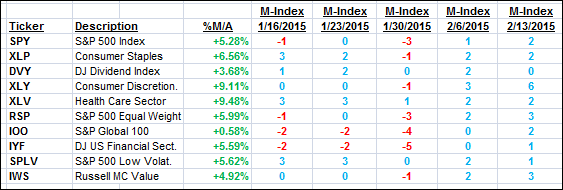
The above table simply demonstrates the magnitude with which some of the ETFs are fluctuating in regards to their positions above or below their respective individual trend lines (%M/A). A break below, represented by a negative number, shows weakness, while a break above, represented by a positive percentage, shows strength.
For hundreds of ETF/Mutual fund choices, be sure to reference Thursday’s StatSheet.
Year to date, here’s how the above candidates have fared so far:
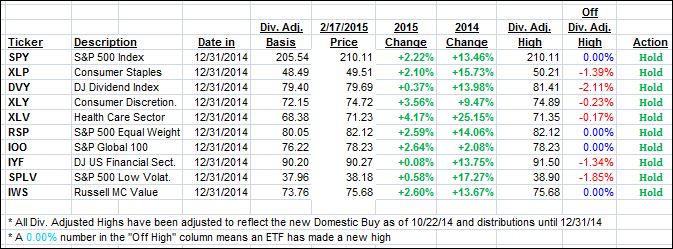
Again, the first table above shows the position of the various ETFs in relation to their respective long term trend lines (%M/A), while the second one tracks their trailing sell stops in the “Off High” column. The “Action” column will signal a “Sell” once the -7.5% point has been taken out in the “Off High” column.
3. Trend Tracking Indexes (TTIs)
Our Trend Tracking Indexes (TTIs) budged only slightly with no change to our current bullish stance.
Here’s how this day ended:
Domestic TTI: +3.57% (last close +3.82%)—Buy signal effective 10/22/2014
International TTI: +2.60% (last close +2.46%)—Buy signal effective 2/13/2015
Disclosure: I am obliged to inform you that I, as well as advisory clients of mine, own some of these listed ETFs. Furthermore, they do not represent a specific investment recommendation for you, they merely show which ETFs from the universe I track are falling within the guidelines specified.
Contact Ulli