
1. Moving the Markets
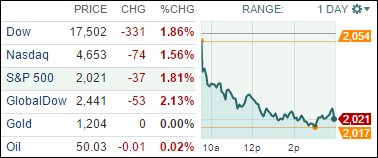
Stocks took their biggest hit in the past couple of months with all major indexes retreating as the chart shows. Crude oil also plunged down to $49.97/barrel today, which is a nine-year low, while Europe benchmarks fell as much as 3.3%.
Traders are fearful that collapsing oil prices somehow signal the rising risk of a global recession; however, many analysts also countered today saying that there are allegedly plenty of policy tools that central bankers can use to stabilize the global economy.
While oil may be a concern at the forefront of all investors’ attention, another concern may be surfacing. After having climbed steadily since the financial crisis, according to Reuters, the net negative credit balances that investors have in their brokerage accounts is reaching record levels and are now starting to raise concerns about overuse of margin debt among ordinary account holders.
Moreover, with potential short-term interest-rate hikes coming as soon as later this year, paying interest on margin debt could soon become a much bigger burden. However, other analysts were quick to counter saying that as long as the U.S. economy continues to steadily climb upwards then there is no need to worry.
Let’s stay tuned to see how the markets shake off the first day jitters of 2015.
All of our 10 ETFs in the Spotlight slipped to varying degrees. Section 3 shows the “Off High” percentages, which I use as a basis for tracking our trailing sell stops.
2. ETFs in the Spotlight
In case you missed the announcement and description of this section, you can read it here again.
It features 10 broadly diversified ETFs from my HighVolume list as posted every Monday. Furthermore, they are screened for the lowest MaxDD% number meaning they have been showing better resistance to temporary sell offs than all others over the past year.
Here are the 10 candidates:
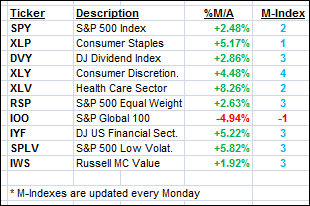
The above table simply demonstrates the magnitude with which some of the ETFs are fluctuating in regards to their positions above or below their respective individual trend lines (%M/A). A break below, represented by a negative number, shows weakness, while a break above, represented by a positive percentage, shows strength.
Year to date, here’s how the above candidates have fared so far:
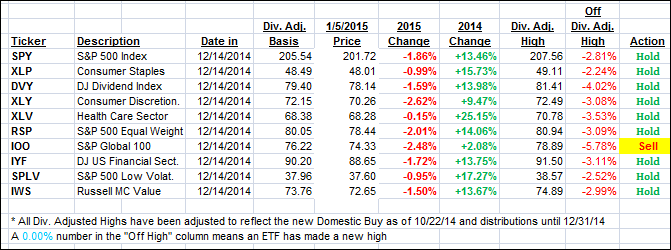
Again, the first table above shows the position of the various ETFs in relation to their respective long term trend lines (%M/A), while the second one tracks their trailing sell stops in the “Off High” column. The “Action” column will signal a “Sell” once the -7.5% point has been taken out in the “Off High” column.
3. Trend Tracking Indexes (TTIs)
Our Trend Tracking Indexes (TTIs) succumbed to the selling pressure with the International one sinking deeper into bear market territory. It’s too early to tell if this is in fact the canary in the coalmine indicating worse things to come.
Here’s how we ended up:
Domestic TTI: +1.87% (last Friday +2.65%)—Buy signal since 10/22/2014
International TTI: -2.66% (last Friday -0.88%)—New Sell signal effective 12/15/14
Disclosure: I am obliged to inform you that I, as well as advisory clients of mine, own some of these listed ETFs. Furthermore, they do not represent a specific investment recommendation for you, they merely show which ETFs from the universe I track are falling within the guidelines specified.
Contact Ulli
Comments 2
Do you post a sell signal for US ETFS/Funds should it occur during the week, between news letters.?
Ed,
Whenever a Buy or Sell signal occurs, I post it to the blog the same day. It also gets emailed to all subscribers, but I recommend you check the blog when we appear to get close, since email delivery is not always very reliable.
Ulli…