
1. Moving the Markets
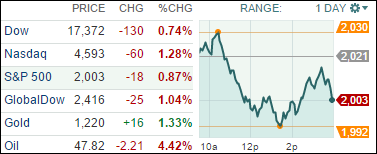
Markets continued their shaky start to 2015 today, as all major indexes finished in negative territory. The Dow has now lost more than 500 points in the last two trading sessions and the S&P 500 is down 2.73% over the first 3 trading sessions of the year.
The culprit behind the markets continued slide appears to still be falling oil prices and woes over the state of the European economy. We also heard some negative sentiment from Bill Gross today (former PIMCO bond giant), who said that “good times are over” and that many asset classes will finish the year with losses.
In regards to Europe, ample concern remains that the ECB won’t be able to curb the Eurozone’s dangerous dance with deflation. Many analysts were saying today that even if the ECB launches a full-scale, Federal Reserve-style government bond-buying program later this month that it may be too much too late.
J.C. Penny was back in the news today. The stock surged more than 20% in after-hours trading once it posted a 3.7% gain in same-store sales for November and December. J.C. Penney had been struggling to regain its footing with customers since a botched revamp in 2012. This Holiday season beats out last year’s November/December same-store sales gain of 3.1%.
All of our 10 ETFs in the Spotlight headed south with the conservative ones like XLP, XLV and SPLV holding up the best.
2. ETFs in the Spotlight
In case you missed the announcement and description of this section, you can read it here again.
It features 10 broadly diversified ETFs from my HighVolume list as posted every Monday. Furthermore, they are screened for the lowest MaxDD% number meaning they have been showing better resistance to temporary sell offs than all others over the past year.
Here are the 10 candidates:
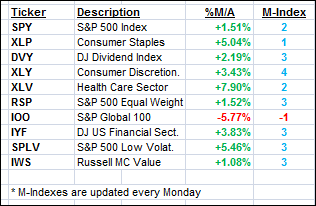
The above table simply demonstrates the magnitude with which some of the ETFs are fluctuating in regards to their positions above or below their respective individual trend lines (%M/A). A break below, represented by a negative number, shows weakness, while a break above, represented by a positive percentage, shows strength.
Year to date, here’s how the above candidates have fared so far:
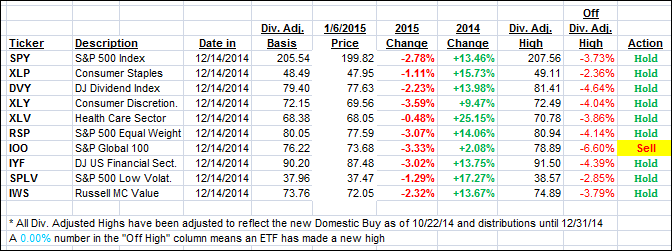
Again, the first table above shows the position of the various ETFs in relation to their respective long term trend lines (%M/A), while the second one tracks their trailing sell stops in the “Off High” column. The “Action” column will signal a “Sell” once the -7.5% point has been taken out in the “Off High” column.
3. Trend Tracking Indexes (TTIs)
Our Trend Tracking Indexes (TTIs) headed south as well; however, the Domestic one clearly remains on the bullish side of the trend line:
Here’s how we ended up:
Domestic TTI: +1.52% (last close +1.87%)—Buy signal since 10/22/2014
International TTI: -3.61% (last close -2.66%)—New Sell signal effective 12/15/14
Disclosure: I am obliged to inform you that I, as well as advisory clients of mine, own some of these listed ETFs. Furthermore, they do not represent a specific investment recommendation for you, they merely show which ETFs from the universe I track are falling within the guidelines specified.
Contact Ulli