
1. Moving the Markets
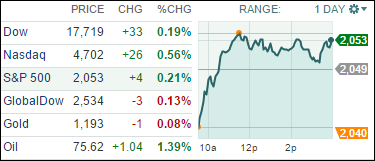
Stocks climbed back into record territory Thursday as investors were bullish on encouraging U.S. economic data. Today, we heard positive reports on lower inflation numbers, stronger home sales and decreasing jobless claims. The S&P 500 gained 0.21%, the Dow rose 0.19% (both finishing at new closing highs) while the Nasdaq climbed 0.56%.
On the flip side of domestic bullish economic news today was the survey of factory activity that came in from China. A preliminary survey of factory activity showed manufacturing in the world’s second-largest economy slid to a 6-month low. The Hang-Seng index dipped 0.1% on the day.
In tech, shares of Apple gained $1.90 or 1.7% today, to close at an all-time high of $116.57. Much of the buzz around Wall Street today centered around whether or not the stock will hit the $118.54 18-month price target, which is the current Wall Street estimate.
As we all know, analysts’ targets have historically proven to be too conservative on the stock. Of course, billionaire Carl Icahn had to chime in today, saying that the stock is worth more than $200 a share — essentially saying the Wall Street analysts that follow the stock are wrong. The question remains…will Apple become the first trillion dollar company?
7 of our 10 ETFs in the Spotlight gained on the day while 4 of them made new highs, as you can see in the YTD table below.
2. ETFs in the Spotlight
In case you missed the announcement and description of this section, you can read it here again.
It features 10 broadly diversified ETFs from my HighVolume list as posted every Monday. Furthermore, they are screened for the lowest MaxDD% number meaning they have been showing better resistance to temporary sell offs than all others over the past year.
Here are the 10 candidates:
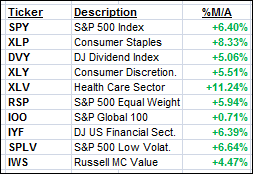
The above table simply demonstrates the magnitude with which some of the ETFs are fluctuating in regards to their positions above or below their respective individual trend lines (%M/A). A break below, represented by a negative number, shows weakness, while a break above, represented by a positive percentage, shows strength.
Year to date, here’s how the above candidates have fared so far:
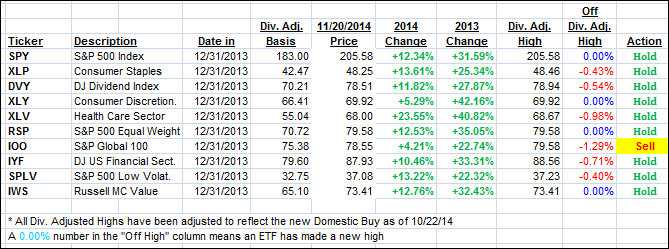
Again, the first table above shows the position of the various ETFs in relation to their respective long term trend lines (%M/A), while the second one tracks their trailing sell stops in the “Off High” column. The “Action” column will signal a “Sell” once the -7.5% point has been taken out in the “Off High” column.
3. Trend Tracking Indexes (TTIs)
Our Trend Tracking Indexes (TTIs) inched up a tad as the sideways to slightly up pattern of the week continued.
Here’s how we ended up:
Domestic TTI: +3.28% (last close +3.10%)—Buy signal since 10/22/2014
International TTI: +0.65% (last close +0.53%)—Sell signal since 10/1/2014
Disclosure: I am obliged to inform you that I, as well as advisory clients of mine, own some of these listed ETFs. Furthermore, they do not represent a specific investment recommendation for you, they merely show which ETFs from the universe I track are falling within the guidelines specified.
Contact Ulli