
1. Moving the Markets
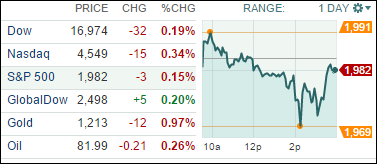
Markets took a quick but short dive after the Fed’s announcement that its monthly bond buying program had come to an end. The major indexes recovered into the close but ended up on the south side of the unchanged line.
The end of this quantitative easing program came as expected with the Fed expressing confidence in the “economy’s prospects.” With this driver of the markets being gone, at least for the time being, we have reached the point where the rubber meets the road. In other words, can the economy stay on its own two feet with enough momentum to keep the market indexes at these elevated levels?
My guess is that we’ll find out pretty soon once the earnings season has died down. The question in my mind is whether the Fed will have the nerve to not step in with another emergency QE program should the markets retreat by some 10% or more.
In the meantime, we will hold on to our invested positions subject to our trailing sell stops and/or trend line breaks of the TTIs.
2. ETFs in the Spotlight
In case you missed the announcement and description of this section, you can read it here again.
It features 10 broadly diversified ETFs from my HighVolume list as posted every Monday. Furthermore, they are screened for the lowest MaxDD% number meaning they have been showing better resistance to temporary sell offs than all others over the past year.
Here are the 10 candidates:
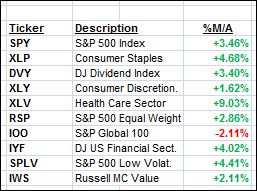
The above table simply demonstrates the magnitude with which some of the ETFs are fluctuating in regards to their positions above or below their respective individual trend lines (%M/A). A break below, represented by a negative number, shows weakness, while a break above, represented by a positive percentage, shows strength.
Year to date, here’s how the above candidates have fared so far:
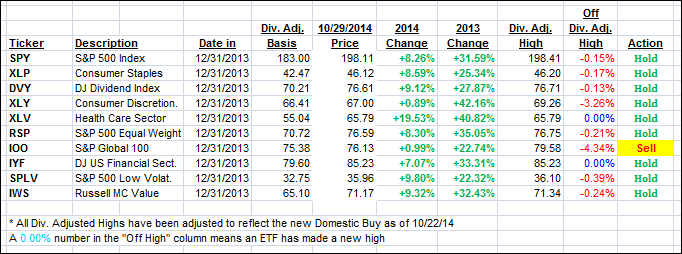
To be clear, the first table above shows the position of the various ETFs in relation to their respective long term trend lines (%M/A), while the second one tracks their trailing sell stops in the “Off High” column. The “Action” column will signal a “Sell” once the -7.5% point has been taken out in the “Off High” column.
3. Trend Tracking Indexes (TTIs)
Our Trend Tracking Indexes (TTIs) both slipped as the majore market indexes meandered without clear direction.
Here’s how we ended up:
Domestic TTI: +2.00% (last close +2.28%)—Buy signal since 10/22/2014
International TTI: -1.81% (last close -1.55%)—Sell signal since 10/1/2014
Disclosure: I am obliged to inform you that I, as well as advisory clients of mine, own some of these listed ETFs. Furthermore, they do not represent a specific investment recommendation for you, they merely show which ETFs from the universe I track are falling within the guidelines specified.
Contact Ulli