
1. Moving the Markets
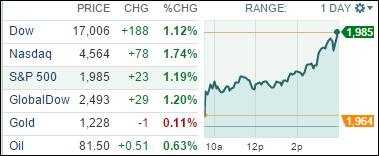
Equities rocketed upwards today after investors were encouraged by multiple solid earnings reports as well as a rise in consumer confidence. The Dow gained 1.12% and closed about 17,000 for the first time since October 3rd. The S&P 500 rose 1.19% and the Nasdaq led the pack gaining 1.74%.
Tech stocks in the Nasdaq got a boost today from the surge in Alibaba (BABA) shares, which pushed past $100 a share for the first time. Apple (AAPL) also gained upon rumors that Alibaba might be working with Apple and its Apple Pay initiative. On the flip side, both Twitter (TWTR) and Facebook (FB) shares took a dive today after releasing less than attractive earnings reports and revenue projections.
In the economy, it was reported today that consumer confidence rose sharply in October, reaching its highest level in seven years despite the volatile stock market and global economic weakness. Outlook rose to 94.5 from 89 in September.
Finally, The Federal Reserve opened a two-day meeting today amid volatile markets and a slowing global economy, but economists say it’s likely to send a stay-the-course message that foresees an increase in near-zero interest rates by mid-2015. The news that got downplayed was that QE officially ended today; so, will the stock market be able to stand on its own legs? I would not hold my breath, but we will find out in due time.
2. ETFs in the Spotlight
In case you missed the announcement and description of this section, you can read it here again.
It features 10 broadly diversified ETFs from my HighVolume list as posted every Monday. Furthermore, they are screened for the lowest MaxDD% number meaning they have been showing better resistance to temporary sell offs than all others over the past year.
Here are the 10 candidates:
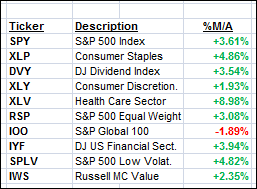
The above table simply demonstrates the magnitude with which some of the ETFs are fluctuating in regards to their positions above or below their respective individual trend lines (%M/A). A break below, represented by a negative number, shows weakness, while a break above, represented by a positive percentage, shows strength.
Year to date, here’s how the above candidates have fared so far:
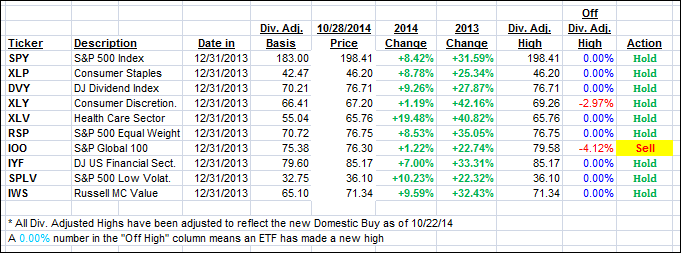
To be clear, the first table above shows the position of the various ETFs in relation to their respective long term trend lines (%M/A), while the second one tracks their trailing sell stops in the “Off High” column. The “Action” column will signal a “Sell” once the -7.5% point has been taken out in the “Off High” column.
3. Trend Tracking Indexes (TTIs)
Our Trend Tracking Indexes (TTIs) improved with the domestic one moving deeper into bullish territory, while the international one rallied as well but remains stuck south of its trend line.
Here’s how we closed:
Domestic TTI: +2.28% (last close +1.50%)—Buy signal since 10/22/2014
International TTI: -1.55% (last close -2.55%)—Sell signal since 10/1/2014
Disclosure: I am obliged to inform you that I, as well as advisory clients of mine, own some of these listed ETFs. Furthermore, they do not represent a specific investment recommendation for you, they merely show which ETFs from the universe I track are falling within the guidelines specified.
Contact Ulli