
1. Moving the Markets
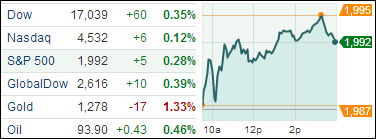
The S&P 500 returned to its record-setting ways, notching its 28th record close of the year, building on a powerful bull run that began more than five years ago. The S&P 500 gained 0.3%, the Dow rose 0.4% but the Nasdaq barely stayed above water gaining 0.1%.
One of the primary market drivers today was the number of Americans filing for first-time jobless claims. Filings fell by 14,000 last week to 298,000 which topped analyst expectations of 303,000.
In tech news, Hewlett-Packard Co (HP) shares gained 5.4% to $37 just one day after the computing company posted a surprising increase in quarterly revenue. Also, shares of eBay (EBAY) jumped 4.7% to $55.89 on a report that the company was contemplating a spinoff of its PayPal unit as soon as next year.
The bull market continues to be driven by low interest rates and soft money policies around the globe. Now that the earnings season has come to a close, we can look back to see that nearly 7 out of 10 companies, or 68%, topped Q2 profit forecasts, above the long-term average of 63%, according to Thomson Reuters. The S&P 500 is on track to post 8.4% profit growth for the quarter, up from 6.2% on July 1.
Joining the party, 9 of our 10 ETFs in the Spotlight rallied with 4 of them making new yearly highs as the YTD table below shows.
2. ETFs in the Spotlight
In case you missed the announcement and description of this section, you can read it here again.
It features 10 broadly diversified ETFs from my HighVolume list as posted every Monday. Furthermore, they are screened for the lowest MaxDD% number meaning they have been showing better resistance to temporary sell offs than all others over the past year.
Here are the 10 candidates:

All of them are currently in “buy” mode, meaning their prices are above their respective long term trend lines by the percentage indicated (%M/A).
Year to date, here’s how the above candidates have fared so far:
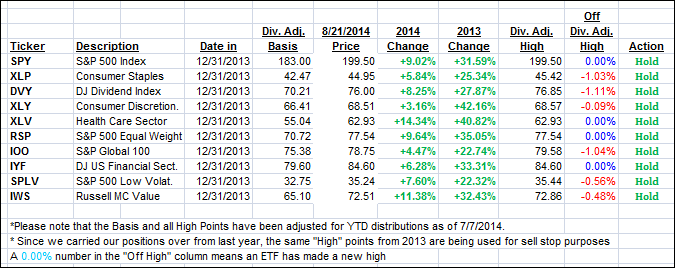
To be clear, the first table above shows the position of the various ETFs in relation to their respective long term trend lines (%M/A), while the second one tracks their trailing sell stops in the “Off High” column. The “Action” column will signal a “Sell” once the -7.5% point is taken out in the “Off High” column.
3. Domestic Trend Tracking Indexes (TTIs)
Our Trend Tracking Indexes (TTIs) inched slightly higher:
Domestic TTI: +3.03% (last close +2.95%)
International TTI: +2.48% (last close +2.16%)
Disclosure: I am obliged to inform you that I, as well as advisory clients of mine, own some of these listed ETFs. Furthermore, they do not represent a specific investment recommendation for you, they merely show which ETFs from the universe I track are falling within the guidelines specified.
Contact Ulli