
1. Moving The Markets
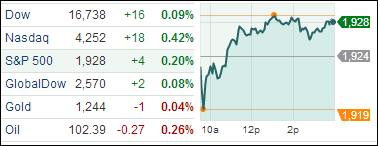
Well, stocks came roaring back today after a solemn Tuesday. The S&P 500 once again closed in record territoryas the chart above shows. The service sector was a leading gainer, as we received a report that showed U.S. service firms grew more quickly as production, hiring and new orders increased. All are interpreted as signs that the economy is accelerating after dipping at the start of the year.
Among the day’s biggest gainers were U.S. solar companies after the United States slapped new import duties on solar panels and other related products from China in a preliminary determination. First Solar (FSLR) rose 3.9% to $65.39.
While markets keep trending up, looking at some other economic numbers might keep our heads a bit more in check. The U.S. trade deficit ($47.2 bil) widened to its highest in almost two years in April as imported goods set a record; U.S. productivity declined even more rapidly than believed in the first quarter as extreme winter weather made businesses far less efficient. The path to forge ahead shall continue to be an uphill battle, needless to say, with the hope being that the GDP growth number hovers around that 2.2% mark.
Our 10 ETFs in the Spotlight improved with 5 of them making new highs today while 9 of them remain on the plus side YTD.
2. ETFs in the Spotlight
In case you missed the announcement and description of this section, you can read it here again.
It features 10 broadly diversified ETFs from my HighVolume list as posted every Monday. Furthermore, they are screened for the lowest MaxDD% number meaning they have been showing better resistance to temporary sell offs than all others over the past year.
In other words, none of them ever triggered their 7.5% sell stop level during this time period, which included a variety of severe market pullbacks but no move into outright bear market territory.
Here are the 10 candidates:
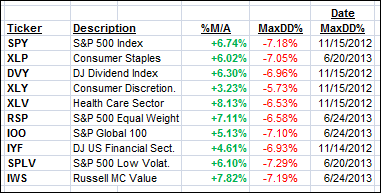
All of them are in “buy” mode, meaning their prices are above their respective long term trend lines by the percentage indicated (%M/A).
Year to date, here’s how the above candidates have fared so far:
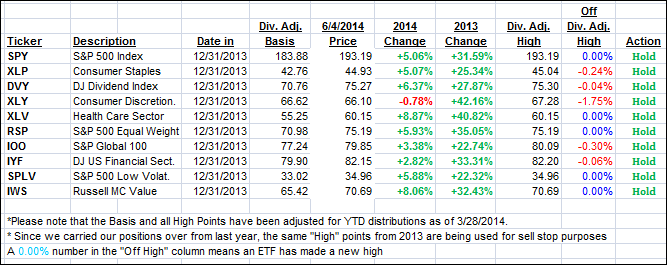
To be clear, the first table above shows the position of the various ETFs in relation to their respective long term trend lines (%M/A), while the second one tracks their trailing sell stops in the “Off High” column. The “Action” column will signal a “Sell” once the -7.5% point is taken out in the “Off High” column.
3. Domestic Trend Tracking Indexes (TTIs)
Our Trend Tracking Indexes (TTIs) followed the market direction by inching up slightly:
Domestic TTI: +3.09% (last close +2.93%)
International TTI: +4.37% (last close +4.31%)
Disclosure: I am obliged to inform you that I, as well as advisory clients of mine, own some of these listed ETFs. Furthermore, they do not represent a specific investment recommendation for you, they merely show which ETFs from the universe I track are falling within the guidelines specified.
Contact Ulli