
The ETF/No Load Fund Tracker
Monthly Review—May 31, 2014
US Equities Mostly Higher In May; Europe Continues To Report Robust Gains
US equities broadly gained in May with all three leading indexes finishing higher for the month with the Dow Jones Industrial Average (DJIA) and the S&P 500 (SPX) hitting new highs.
The blue-chip Dow ended May up 2.1 percent for the month. The benchmark S&P added 2.1 percent to finish at 1,923.57.
The NASDAQ composite index picked up 3.1 percent in May to end at 4,242.62. That was the tech-heavy index’s first monthly gain since February.
Both the DJIA and the NASDAQ turned positive for the year in May.
The US economy continued to heal after logging in disappointing GDP numbers in the first quarter. The Federal Reserve’s favorite gauge for inflation – the Personal Consumption Expenditure Price – surged 1.6 percent in the 12 months through April from 1.1 percent in March, posting the biggest gain since November 2012. Higher PCEP indicates firming up of consumer demand and bodes well for the economy as consumption makes up for about 70 percent of GDP.
The Chicago-area Institute for Supply Management’s business barometer unexpectedly jumped to 65.5 from 63 in April. The May reading was a seven-month high and well above economists forecast for a monthly print of 61. Readings above 50 indicate expansion from the previous month.
Separately, the National Association for Realtors said a gauge for pending home sales rose 0.4 percent in April, marking the second consecutive gain since the slump that started last summer.
Data released by the Commerce Department showed US single-family home sales jumped 6.4 percent to an annual rate of 433,000 in April. That was higher than the 429,000 units most economists had projected and compared with the upwardly revised 407,000 reading reported for March.
Minutes from the Fed’s April meeting showed officials discussed several approaches about tightening of monetary policy going forward while acknowledging the need to improve guidance on interest rates.
The Institute for Supply Management’s manufacturing index rose to 55.4 in May from 54.9 in April. The factory output gauge rose at the fastest pace this year and was well above the initial “flash” print of 53.2.
On the downside, consumer spending fell in April as Americans spent less on utilities and cut back on car purchases. The decline was led by a 3 percent drop in spending on natural gas as the weather warmed up and nullified March’s upwardly revised 1 percent gain.
Across the Atlantic, European stocks continued to advance in May despite inflation in the 18-member euro area deteriorating during the month. The Stoxx Europe 600 index finished at 344.24, capping its monthly gain at 1.9 percent. The benchmark index has added about 5 percent since January and hit a six-year high during the month.
Annual inflation rate in Spain fell to 0.2 percent in May from 0.3 percent in April, while Italy’s inflation rate dropped to 0.4 percent from 0.5 percent. Inflation in Germany fell sharply last month, stoking speculation the European Central Bank will ease policies further when they meet on June 5. EU-harmonized annual inflation rate slumped to 0.6 percent last month from 1.1 percent in April in Europe’s largest economy.
Data released by Eurostat showed unemployment rate in the euro area fell to 11.7 percent in April from 11.8 percent in March. April’s jobless level beat forecasts of an 11.8 percent reading.
Technically speaking, our Domestic Trend Tracking Index (TTI) remains firmly entrenched in its long-term bullish pattern and actually made new highs during May as the chart below shows:
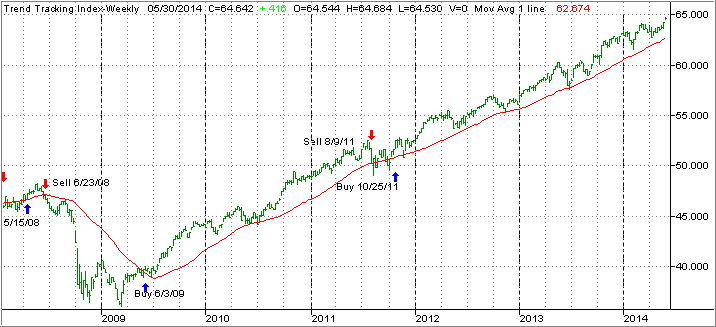
Market pullbacks were well contained and of short duration before the major trend reestablished itself pushing the benchmark indexes along with our TTI higher and into unchartered territory. Despite the daily onslaught of wild and opposing market predictions in the financial media, it’s best to continue the path of staying with our positions until a trend change advises us otherwise.
Our main holdings showed far less volatility as in the month before as you can see in the 30-day chart:
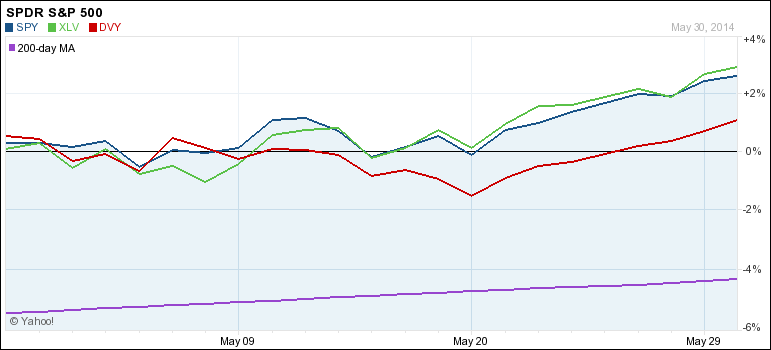
The past 30 days gave us a pretty smooth ride in that the trading ranges of the various indexes were less broad, which means we never came close to having any sell stops triggered.
The S&P 500 successfully not only conquered its 1,900 milestone marker on May 23rd but has also managed to stay above it ever since. With earnings season being over, I think a new driver is needed to propel these markets higher; otherwise we might get stuck in a trading range again.
Of course, a pullback with unknown magnitude from these lofty levels is always a possibility, so I will be watching our sell stops closely and head for the exit doors, should the need arise.
Contact Ulli