
1. Moving The Markets
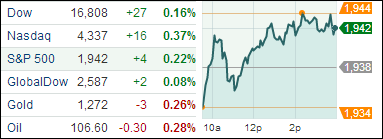
It was a wobbly beginning, but the major indexes managed to pick up a little steam later in the session just enough to end up in the green for the third day in a row. The gains were modest as the above chart shows.
Even a sharp rise in consumer prices in May (+0.4% after climbing 0.3% the prior month), reduced housing starts and continued violence in Iraq could not keep equities down for long and it appeared that the path of least resistance was higher.
All eyes are now feasted on the outcome of the FOMC meeting tomorrow, although it is widely assumed that there will be no change in interest rate policy in the foreseeable future.
Some of our 10 ETFs in the Spotlight edged up with one of them making a new high; 9 of them are remaining on the plus side YTD.
2. ETFs in the Spotlight
In case you missed the announcement and description of this section, you can read it here again.
It features 10 broadly diversified ETFs from my HighVolume list as posted every Monday. Furthermore, they are screened for the lowest MaxDD% number meaning they have been showing better resistance to temporary sell offs than all others over the past year.
In other words, none of them ever triggered their 7.5% sell stop level during this time period, which included a variety of severe market pullbacks but no move into outright bear market territory.
Here are the 10 candidates:
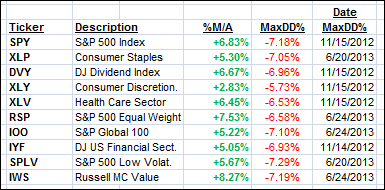
All of them are in “buy” mode, meaning their prices are above their respective long term trend lines by the percentage indicated (%M/A).
Year to date, here’s how the above candidates have fared so far:
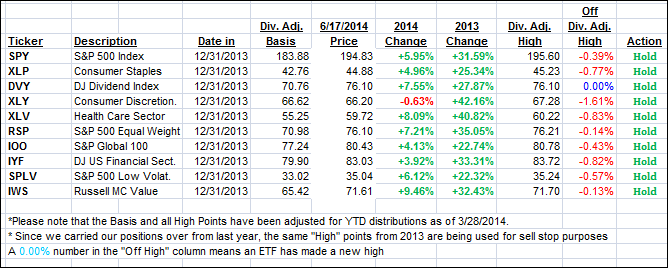
To be clear, the first table above shows the position of the various ETFs in relation to their respective long term trend lines (%M/A), while the second one tracks their trailing sell stops in the “Off High” column. The “Action” column will signal a “Sell” once the -7.5% point is taken out in the “Off High” column.
3. Domestic Trend Tracking Indexes (TTIs)
Our Trend Tracking Indexes (TTIs) changed only insignificantly:
Domestic TTI: +3.28% (last close +3.21%)
International TTI: +4.03% (last close +4.03%)
Disclosure: I am obliged to inform you that I, as well as advisory clients of mine, own some of these listed ETFs. Furthermore, they do not represent a specific investment recommendation for you, they merely show which ETFs from the universe I track are falling within the guidelines specified.
Contact Ulli