
1. Moving The Markets
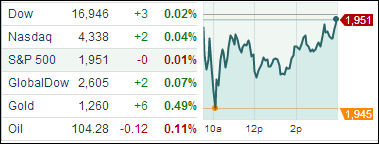
Stocks moved in both directions today with the Dow closing in positive territory while the S&P 500 finished just inside the red zone. The stock market has been on a slow and steady climb since April, and in recent weeks has been pushed by a number of encouraging economic reports. At present, the S&P 500 is up 5.5% on the year.
EBay Inc. (EBAY) dropped 2.7% after saying David Marcus will step down as the head of its PayPal unit to join Facebook Inc. And in M&A news, Tyson Foods Inc. (TSN) slid 3.8 percent to $36.07, capping a sixth day of losses, the longest streak since September. The largest U.S. meat company closed yesterday at the lowest since February after raising its offer for Hillshire Brands Co. (HSH) to about $7.7 billion.
When was the last time you went to RadioShack? If you said more than nine months ago then you may be to blame. RadioShack (RSH), the consumer electronics retailer, said its first-quarter loss widened to $98.3 million as sales slid for the ninth straight quarter. The stock is now trading at $1.38 and analysts are really questioning how much longer they can keep the doors open.
Our 10 ETFs in the Spotlight barely moved; however, SPY managed to eke out a new high today.
2. ETFs in the Spotlight
In case you missed the announcement and description of this section, you can read it here again.
It features 10 broadly diversified ETFs from my HighVolume list as posted every Monday. Furthermore, they are screened for the lowest MaxDD% number meaning they have been showing better resistance to temporary sell offs than all others over the past year.
In other words, none of them ever triggered their 7.5% sell stop level during this time period, which included a variety of severe market pullbacks but no move into outright bear market territory.
Here are the 10 candidates:
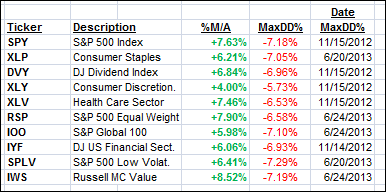
All of them are in “buy” mode, meaning their prices are above their respective long term trend lines by the percentage indicated (%M/A).
Year to date, here’s how the above candidates have fared so far:
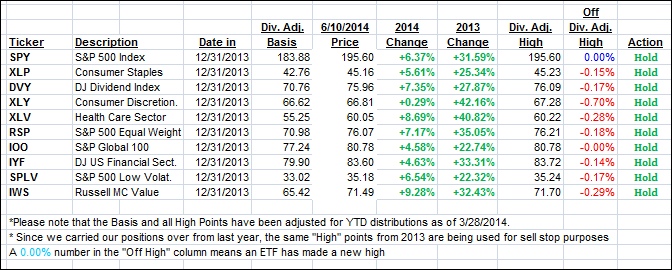
To be clear, the first table above shows the position of the various ETFs in relation to their respective long term trend lines (%M/A), while the second one tracks their trailing sell stops in the “Off High” column. The “Action” column will signal a “Sell” once the -7.5% point is taken out in the “Off High” column.
3. Domestic Trend Tracking Indexes (TTIs)
Our Trend Tracking Indexes (TTIs) remained unchanged:
Domestic TTI: +3.65% (last close +3.65%)
International TTI: +4.92% (last close +4.92%)
Disclosure: I am obliged to inform you that I, as well as advisory clients of mine, own some of these listed ETFs. Furthermore, they do not represent a specific investment recommendation for you, they merely show which ETFs from the universe I track are falling within the guidelines specified.
Contact Ulli