1. Moving The Markets
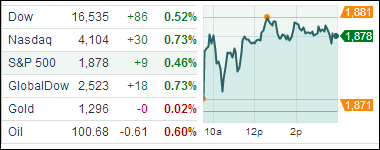
Stocks continued to move higher today, driven by continued positive earnings announcements. The major indexes climbed as the chart shows but the Nasdaq led with a gain of 0.73% on the day.
Notable corporate earnings announcements, that exceeded analyst expectations included Merck & Co (MRK) and Sprint (S). Q1 profit growth for S&P 500 companies is at 3.7% compared with a forecast for 2.1% at the beginning of the month. This bodes well for those who are looking to capitalize on those corporate earnings announcements left in the pipeline. This is another big week for earnings announcements with 135 companies in the S&P 500 reporting.
Looking ahead, the Federal Reserve ends its two-day meeting Wednesday with the release of its closely watched policy statement, while the U.S. government will release its April jobs report on Friday.
In international news, Chrysler’s shot at a significant slice of sales in China, the world’s largest auto market, has taken a major step forward with a deal to build three Jeep SUVs there in a venture with Guangzhou Automobile. Production of SUVs in China is expected to rise to 6 million by 2020, nearly twice the 3.15 million produced in 2013.
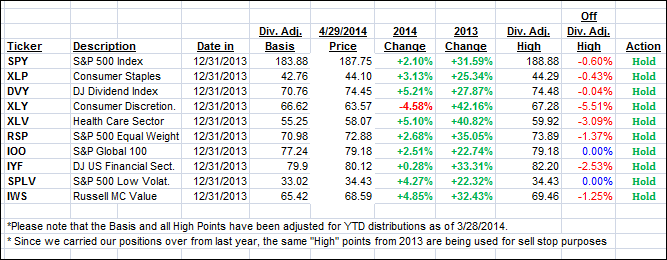
Our 10 ETFs in the Spotlight gained with 2 of them making new highs today while 9 of them are now in the green YTD.
2. ETFs in the Spotlight
In case you missed the announcement and description of this section, you can read it here again.
It features 10 broadly diversified ETFs from my HighVolume list as posted every Monday. Furthermore, they are screened for the lowest MaxDD% number meaning they have been showing better resistance to temporary sell offs than all others over the past year.
In other words, none of them ever triggered their 7.5% sell stop level during this time period, which included a variety of severe market pullbacks but no move into outright bear market territory.
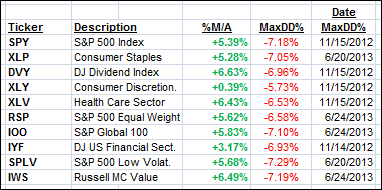
Here are the 10 candidates:
All of them are in “buy” mode, meaning their prices are above their respective long term trend lines by the percentage indicated (%M/A).
Year to date, here’s how the above candidates have fared so far:
To be clear, the first table above shows the position of the various ETFs in relation to their respective long term trend lines (%M/A), while the second one tracks their trailing sell stops in the “Off High” column. The “Action” column will signal a “Sell” once the -7.5% point is taken out in the “Off High” column.
3. Domestic Trend Tracking Indexes (TTIs)
Our Trend Tracking Indexes (TTIs) picked up some steam and moved deeper into bullish territory:
Domestic TTI: +2.13% (last close +1.86%)
International TTI: +3.35% (last close +2.80%)
Disclosure: I am obliged to inform you that I, as well as advisory clients of mine, own some of these listed ETFs. Furthermore, they do not represent a specific investment recommendation for you, they merely show which ETFs from the universe I track are falling within the guidelines specified.
Contact Ulli


