
1. Moving The Markets
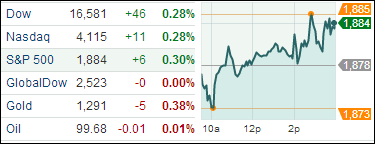
Volatility was still the name of the game on this last day of April just as it has been for quite some time. All the major indexes gained while the S&P 500 managed to eke out a modest +0.64% for the month.
As expected, the Fed announced a reduction of $10 billion in its monthly bond buying program from $55 billion to $45 billion. Key interest rates remained unchanged despite weak GDP growth in the first quarter, which almost came to a standstill. Of course, there always hopeful optimists who believe that the Fed’s tapering means the economy is improving and should soon be able to carry its own weight. Personally, I have not seen enough data to support that view.
Although private sector hiring improved in April with employers adding the most jobs in some 5 months. The Chicago PMI also rebounded last month at the fastest pace in six months.
Our 10 ETFs in the Spotlight headed modestly higher with 3 of them making new highs today while 9 of them are now in the green YTD.
2. ETFs in the Spotlight
In case you missed the announcement and description of this section, you can read it here again.
It features 10 broadly diversified ETFs from my HighVolume list as posted every Monday. Furthermore, they are screened for the lowest MaxDD% number meaning they have been showing better resistance to temporary sell offs than all others over the past year.
In other words, none of them ever triggered their 7.5% sell stop level during this time period, which included a variety of severe market pullbacks but no move into outright bear market territory.
Here are the 10 candidates:
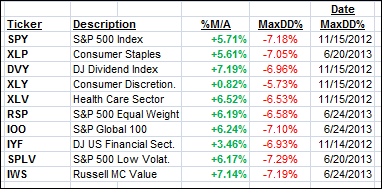
All of them are in “buy” mode, meaning their prices are above their respective long term trend lines by the percentage indicated (%M/A).
Year to date, here’s how the above candidates have fared so far:
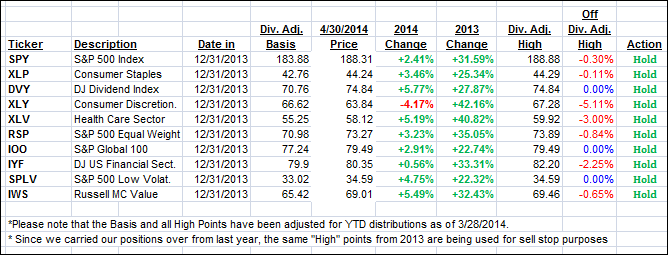
To be clear, the first table above shows the position of the various ETFs in relation to their respective long term trend lines (%M/A), while the second one tracks their trailing sell stops in the “Off High” column. The “Action” column will signal a “Sell” once the -7.5% point is taken out in the “Off High” column.
3. Domestic Trend Tracking Indexes (TTIs)
Our Trend Tracking Indexes (TTIs) inched higher and ended as follows:
Domestic TTI: +2.41% (last close +2.13%)
International TTI: +3.59% (last close +3.35%)
Disclosure: I am obliged to inform you that I, as well as advisory clients of mine, own some of these listed ETFs. Furthermore, they do not represent a specific investment recommendation for you, they merely show which ETFs from the universe I track are falling within the guidelines specified.
Contact Ulli