
1. Moving The Markets
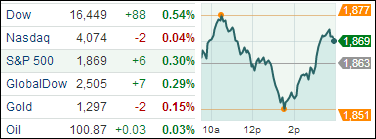
The market swayed back and forth today, but finished in positive territory across the board with the exception of the Nasdaq. And, despite today’s intraday volatility and chaotic price action, many major market indexes are not far from all-time highs.
Although markets ended up for the day, there was a notable selloff in big name social media stocks such as LinkedIn (LNKD), Facebook (FB), Yelp (YELP) and the Chinese social media company that went public earlier this month Weibo (WB).
In M&A news, takeover talks remain the buzz as Pfizer (PFE) reaffirmed its commitment to its potential $100 billion bid for AstraZeneca (AZN), while General Electric (GE) is reportedly attempting to buy Alstom’s (ALSMY) power turbines business.
We are still in the midst of Q1 earnings season announcements, with Twitter Inc (TWTR) and Nokia Corporation (NOK) among the high-profile names with earnings announcements coming up tomorrow. Amazon (AMZN) took a blow today after its sub-par earnings report. The stock continued its slide from Friday falling 3.1% on the day. Overall though, the majority of corporate earnings announcements have been exceeding reduced analyst’s forecasts.
Our 10 ETFs in the Spotlight inched higher with 3 of them making new highs today while 8 of them are remaining in the green YTD.
2. ETFs in the Spotlight
In case you missed the announcement and description of this section, you can read it here again.
It features 10 broadly diversified ETFs from my HighVolume list as posted every Monday. Furthermore, they are screened for the lowest MaxDD% number meaning they have been showing better resistance to temporary sell offs than all others over the past year.
In other words, none of them ever triggered their 7.5% sell stop level during this time period, which included a variety of severe market pullbacks but no move into outright bear market territory.
Here are the 10 candidates:
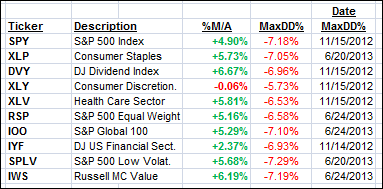
All of them are in “buy” mode, meaning their prices are above their respective long term trend lines by the percentage indicated (%M/A).
Year to date, here’s how the above candidates have fared so far:
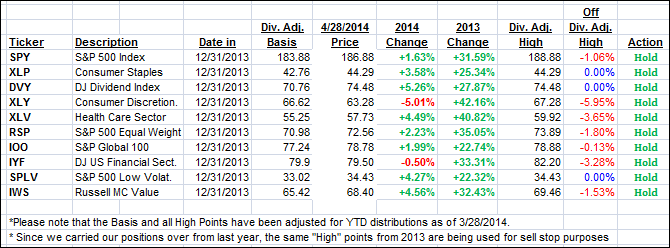
To be clear, the first table above shows the position of the various ETFs in relation to their respective long term trend lines (%M/A), while the second one tracks their trailing sell stops in the “Off High” column. The “Action” column will signal a “Sell” once the -7.5% point is taken out in the “Off High” column.
3. Domestic Trend Tracking Indexes (TTIs)
Our Trend Tracking Indexes (TTIs) remained just about unchanged:
Domestic TTI: +1.86% (last close +1.86%)
International TTI: +2.80% (last close +2.74%)
Disclosure: I am obliged to inform you that I, as well as advisory clients of mine, own some of these listed ETFs. Furthermore, they do not represent a specific investment recommendation for you, they merely show which ETFs from the universe I track are falling within the guidelines specified.
Contact Ulli