
1. Moving The Markets
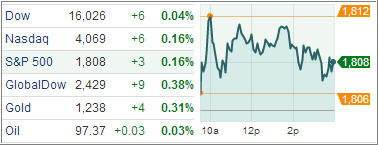
Stocks ended slightly higher on Monday as investors awaited more clues from the Federal Reserve on whether the central bank will soon begin to wind down its economic stimulus. Perhaps the largest bit of news today was in the food industry where Sysco Corp announced it will buy US Foods Inc for about $3.5 billion from its private equity owners. This deal will combine the top two U.S. food distributors and create a company commanding at least a quarter of the $235 billion North American market.
The Nikkei is up nearly 51 pct year-to-date and is thus headed for its best yearly gain since 1972. The decrease in the Yen largely spurred the Nikkei’s climb today. Declines in the yen tend to boost sentiment towards Japanese equities because investors expect the weaker currency will inflate overseas earnings for exporters.
Markets looked better in Europe today as European shares edged up from the previous session with Chinese export data encouraging investors to anticipate stronger global growth. China’s exports handily beat forecasts in November and an unexpected drop in consumer inflation eased fears of any imminent policy tightening, helping to sustain a rally in global shares which had been fuelled by estimate-beating jobs data from the United States on Friday.
In ETFs, the top moving funds were the (AGA) PowerShares DB Agriculture Double Short, the (UGAZ) VelocityShares 3x Long Natural Gas ETN and (once again) the (NUGT) Direxion Daily Gold Miners Bull 3X Shares.
Our ETFs in the Spotlight edged up as well with two of them making new highs for the year:
2. ETFs in the Spotlight
In case you missed the announcement and description of this section, you can read it here again.
It features 10 broadly diversified ETFs from my HighVolume list as posted every Monday. Furthermore, they are screened for the lowest MaxDD% number meaning they have been showing better resistance to temporary sell offs than all others over the past year.
In other words, none of them ever triggered their 7.5% sell stop level during this time period, which included a variety of severe market pullbacks but no move into outright bear market territory.
Here are the 10 candidates:
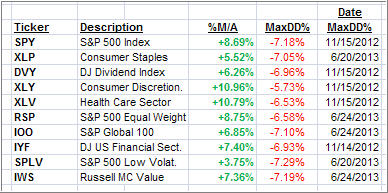
All of them are in “buy” mode meaning their prices are above their respective long term trend lines by the percentage indicated (%M/A).
Now let’s look at the MaxDD% column and review the ETF with the lowest drawdown as an example. As you can see, that would be XLY with the lowest MaxDD% number of -5.73%, which occurred on 11/15/2012.
The recent sell off in the month of June did not affect XLY at all as its “worst” MaxDD% of -5.73% still stands since the November 2012 sell off.
A quick glance at the last column showing the date of occurrences confirms that five of these ETFs had their worst drawdown in November 2012, while the other five were affected by the June 2013 swoon, however, none of them dipped below their -7.5% sell stop.
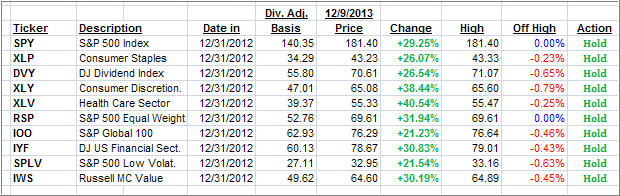
Year to date, here’s how the above candidates have fared so far:
3. Domestic Trend Tracking Indexes (TTIs)
Trend wise, our Trend Tracking Indexes (TTIs) built slightly on Friday’s rally and edged higher by the following percentages:
Domestic TTI: +4.41% (last close +4.34%)
International TTI: +6.20% (last close +5.96%)
Disclosure: I am obliged to inform you that I, as well as advisory clients of mine, own some of these listed ETFs. Furthermore, they do not represent a specific investment recommendation for you, they merely show which ETFs from the universe I track are falling within the guidelines specified.
Contact Ulli