1. Moving The Markets
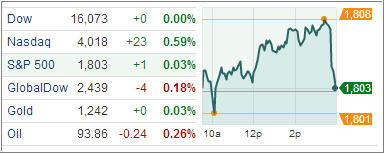
Stocks ended in the green, but just barely as traders took profits ahead of the holiday. The Nasdaq composite index closed above 4,000 on Tuesday for the first time since 2000, while the Dow and S&P ended barely changed. Retailers and homebuilders were among the best performing sectors, responding to stronger-than-expected earnings and robust housing market data. Given the steady and solid performance of the stock market over the past couple of months, perhaps the take away here is that the whole partial government shutdown thing was a real non-event. Trading is still expected to remain light this week, with financial markets closed Thursday for the Thanksgiving holiday.
Internationally, European stocks dipped on Tuesday, as corporate profit warnings and lower-than-expected U.S. consumer confidence data kept benchmark indexes in ranges that were set earlier this month. With Europe’s earnings season drawing to an end, results have been disappointing. About half of companies missed profit forecasts and nearly two-thirds have missed revenue forecasts, according to data from Thomson Reuters StarMine.
Gold was all the roar in the ETF world today. We saw major gold-mining ETFs lose ground as the industry’s tango with the Federal Reserve continues. Concerns over the much-anticipated tapering (of quantitative easing) continue to keep downward pressure on gold prices, with the spot price off nearly 0.75 percent on Tuesday. Keep an eye out for the effects of the anticipated tapering on commodities such as gold in the weeks to come.
Here is the latest update of our ETFs in the Spotlight:
2. ETFs in the Spotlight
In case you missed the announcement and description of this section, you can read it here again.
It features 10 broadly diversified ETFs from my HighVolume list as posted every Monday. Furthermore, they are screened for the lowest MaxDD% number meaning they have been showing better resistance to temporary sell offs than all others over the past year.
In other words, none of them ever triggered their 7.5% sell stop levels during this time period, which included a variety of severe market pullbacks but no move into outright bear market territory.
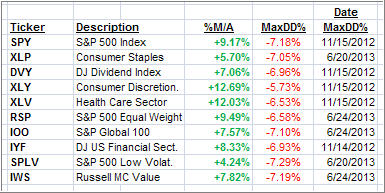
Here are the 10 candidates:
All of them are in “buy” mode meaning their prices are above their respective long term trend lines by the percentage indicated (%M/A).
Now let’s look at the MaxDD% column and review the ETF with the lowest drawdown as an example. As you can see, that would be XLY with the lowest MaxDD% number of -5.73%, which occurred on 11/15/2012.
The recent sell off in the month of June did not affect XLY at all as its “worst” MaxDD% of -5.73% still stands since the November 2012 sell off.
A quick glance at the last column showing the date of occurrences confirms that five of these ETFs had their worst drawdown in November 2012, while the other five were affected by the June 2013 swoon, however, none of them dipped below their -7.5% sell stop.
Year to date, here’s how the above candidates have fared so far:
3. Domestic Trend Tracking Indexes (TTIs)
Trend wise, our Trend Tracking Indexes (TTIs) continue to offer a mixed view as the Domestic TTI edged up a bit while the International TTI retreated slightly:
Domestic TTI: +4.97% (last close +4.73%)
International TTI: +7.52% (last close +7.62%)
Disclosure: I am obliged to inform you that I, as well as advisory clients of mine, own some of these listed ETFs. Furthermore, they do not represent a specific investment recommendation for you, they merely show which ETFs from the universe I track are falling within the guidelines specified.
Contact Ulli


