
1. Moving The Markets
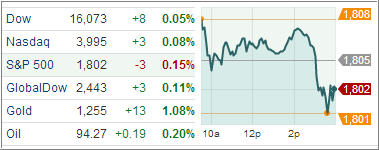
The major indexes appeared to meander aimlessly with the Dow and Nasdaq edging slightly higher while the S&P 500 dropped late in the session to post a minor loss.
After breaking major milestones last week, the market looked a little tired as volume slowed down during this Holiday shortened week, which can easily exaggerate directional moves. The weekend deal between six global powers and Iran, to curb Teheran’s nuclear program had, while making headlines news, only a limited market effect as details still remain sketchy.
One immediate effect was a drop in oil prices which, should they last, will have a positive economic effect. Most of our ETFs in the spotlight came off their highs by a small margin, while two of them made new highs.
Let’s take a look:
2. ETFs in the Spotlight
In case you missed the announcement and description of this section, you can read it here again.
It features 10 broadly diversified ETFs from my HighVolume list as posted every Monday. Furthermore, they are screened for the lowest MaxDD% number meaning they have been showing better resistance to temporary sell offs than all others over the past year.
In other words, none of them ever triggered their 7.5% sell stop levels during this time period, which included a variety of severe market pullbacks but no move into outright bear market territory.
Here are the 10 candidates:
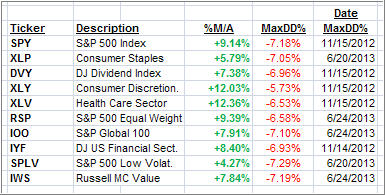
All of them are in “buy” mode meaning their prices are above their respective long term trend lines by the percentage indicated (%M/A).
Now let’s look at the MaxDD% column and review the ETF with the lowest drawdown as an example. As you can see, that would be XLY with the lowest MaxDD% number of -5.73%, which occurred on 11/15/2012.
The recent sell off in the month of June did not affect XLY at all as its “worst” MaxDD% of -5.73% still stands since the November 2012 sell off.
A quick glance at the last column showing the date of occurrences confirms that five of these ETFs had their worst drawdown in November 2012, while the other five were affected by the June 2013 swoon, however, none of them dipped below their -7.5% sell stop.
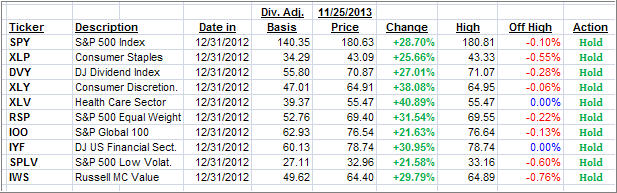
Year to date, here’s how the above candidates have fared so far:
3. Domestic Trend Tracking Indexes (TTIs)
Trend wise, our Trend Tracking Indexes (TTIs) offered a mixed view as the Domestic TTI slipped a tad while the International TTI edged slightly higher:
Domestic TTI: +4.73% (last week +4.77%)
International TTI: +7.62% (last week +7.42%)
Have a great week.
Ulli…
Disclosure: I am obliged to inform you that I, as well as advisory clients of mine, own some of these listed ETFs. Furthermore, they do not represent a specific investment recommendation for you, they merely show which ETFs from the universe I track are falling within the guidelines specified.
Contact Ulli