
1. Moving The Markets
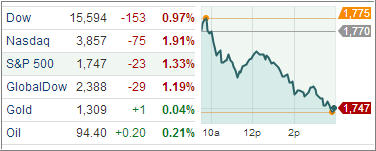
Markets tumbled the most in a month as soft consumer spending growth in the third-quarter raised questions about the overall strength of the economic recovery. The BetaPro MSCI Emerging Markets Bull+ & Bear+ ETF shares are currently trading down about 3.3% on the day. Overshadowing disappointing headlines was Twitter’s more than 70% rise on the day of its initial public offering. Turn that frown upside down Facebook!
Stocks were gaining in pre-market trading as the European Central Bank slashed its benchmark interest rate to stimulate growth in the region. The bank lowered borrowing costs to a record low of 0.25% as policymakers continue fight deflation and weak growth rates across the Eurozone.
Keep a look out for some expected market moving events coming up next week. France is the second-largest economy in the Eurozone, and the fifth-largest in the world. With 10% unemployment and an expected 0.5% growth rate, this Sunday’s French presidential election could have major consequences for the Eurozone.
Let’s review the ETFs in the spotlight:
2. ETFs in the Spotlight
In case you missed the announcement and description of this section, you can read it here again.
It features 10 broadly diversified ETFs from my HighVolume list as posted every Monday. Furthermore, they are screened for the lowest MaxDD% number meaning they have been showing better resistance to temporary sell offs than all others over the past year.
In other words, all of them never triggered their 7.5% sell stop level during this time period, which included a variety of severe market pullbacks but no move into outright bear market territory.
Here are the 10 candidates:
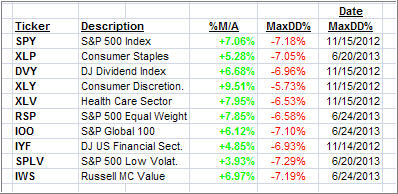
All of them are in “buy” mode meaning their prices are above their respective long term trend lines by the percentage indicated (%M/A).
Now let’s look at the MaxDD% column and review the ETF with the lowest drawdown as an example. As you can see, that would be XLY with the lowest MaxDD% number of -5.73%, which occurred on 11/15/2012.
The recent sell off in the month of June did not affect XLY at all as its “worst” MaxDD% of -5.73% still stands since the November 2012 sell off.
A quick glance at the last column showing the date of occurrences confirms that five of these ETFs had their worst drawdown in November 2012, while the other five were affected by the June 2013 swoon, however, none of them dipped below their -7.5% sell stop.
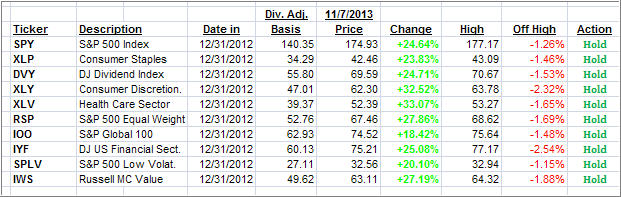
Year to date, here’s how the above candidates have fared so far:
3. Domestic Trend Tracking Indexes (TTIs)
Trend wise, our Trend Tracking Indexes (TTIs) moved south but remain above their long term trend lines by the following percentages:
Domestic TTI: +3.77% (yesterday +4.59%)
International TTI: +6.40% (yesterday +7.42%)
Disclosure: I am obliged to inform you that I, as well as advisory clients of mine, own some of these listed ETFs. Furthermore, they do not represent a specific investment recommendation for you, they merely show which ETFs from the universe I track are falling within the guidelines specified.
Contact Ulli