
1. Moving The Markets
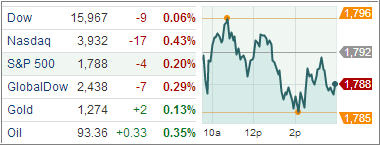
Stocks ended lower as investors digested a mixed batch of retail earnings reports and benchmark indexes struggled to surpass major milestones. However, a recovery in the U.S. housing market helped Home Depot top profit and sales estimates for the third quarter, prompting the No. 1 home improvement chain to raise its fiscal-year outlook for the third time this year.
Major news today centered on the JPMorgan settlement that was reached with the U.S. Government. JPMorgan Chase has reached a $13 billion agreement with the U.S. government settling claims that the nation’s largest bank by assets misrepresented the quality of its mortgages in the lead up to the financial crisis. The deal is the largest settlement ever between the government and a corporation. While this was the big chunk of cash that JPMorgan Chase will have to fork over to the government, JPMorgan said last month that it has set aside $23 billion to cover further litigation expenses.
In the ETF world, the majority of sectors closed the day in the red except for energy, financials and healthcare. Consumer staples still maintain their lead in terms of Q4 performance, posting an 8.14% gain thus far. If you may not already know, the Winklevoss twins are planning to launch an exchange traded product holding Bitcoinns, which has been met with some over-the-top negative reactions from many financial journals and bloggers.
Winklevoss and his brother Cameron reportedly own about 1% of the Bitcoin market, or roughly $10 million. Of course, that number fluctuates because Bitcoin prices can be extremely volatile. However, it can sometimes take years for the SEC to declare a product “effective,” so don’t expect an ETF tracking a virtual currency to come out anytime soon.
Instead, let’s let’s look at some real numbers via our ETFs in the spotlight:
2. ETFs in the Spotlight
In case you missed the announcement and description of this section, you can read it here again.
It features 10 broadly diversified ETFs from my HighVolume list as posted every Monday. Furthermore, they are screened for the lowest MaxDD% number meaning they have been showing better resistance to temporary sell offs than all others over the past year.
In other words, all of them never triggered their 7.5% sell stop level during this time period, which included a variety of severe market pullbacks but no move into outright bear market territory.
Here are the 10 candidates:
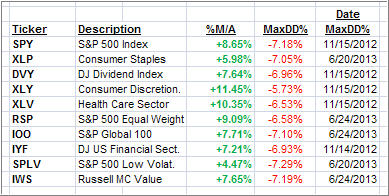
All of them are in “buy” mode meaning their prices are above their respective long term trend lines by the percentage indicated (%M/A).
Now let’s look at the MaxDD% column and review the ETF with the lowest drawdown as an example. As you can see, that would be XLY with the lowest MaxDD% number of -5.73%, which occurred on 11/15/2012.
The recent sell off in the month of June did not affect XLY at all as its “worst” MaxDD% of -5.73% still stands since the November 2012 sell off.
A quick glance at the last column showing the date of occurrences confirms that five of these ETFs had their worst drawdown in November 2012, while the other five were affected by the June 2013 swoon, however, none of them dipped below their -7.5% sell stop.
Year to date, here’s how the above candidates have fared so far:
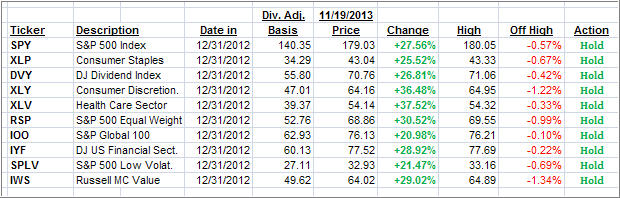
All ETFs have come off their highs with the market slippage of the past couple of days, but they remain solidly bullish.
3. Domestic Trend Tracking Indexes (TTIs)
Our Trend Tracking Indexes (TTIs) retreated slightly and closed the day as follows:
Domestic TTI: +4.40% (previous +4.68%)
International TTI: +7.50% (previous +7.73%)
Disclosure: I am obliged to inform you that I, as well as advisory clients of mine, own some of these listed ETFs. Furthermore, they do not represent a specific investment recommendation for you, they merely show which ETFs from the universe I track are falling within the guidelines specified.
Contact Ulli
Comments 2
Why is the 39 week SMA used in the Trend Tracking? If I missed that discussion please excuse. Thank You
Franz,
When I developed the Trend Tracking Indexes back in the 1980s, I experimented with various SMAs but found the 39 week SMA most appropriate. Subsequently, I never found a valid reason to change that.
Ulli…