
1. Moving The Markets
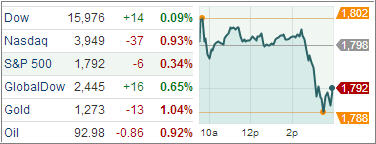
Many spectators held their breath today as both the S&P and Dow both strained to reach their all-time highs of 1,800 and 16,000 respectively. But alas, neither index could hold on to the mighty achievements as both eventually dropped to 1,791 and 15,976. Still, the Dow and S&P 500 are up more than 20% so far in 2013. This 5-year bull market that we have experienced has been phenomenal, but might reverse if simulative monetary policies are scaled back.
Major market movers for Monday were Boeing, Tesla, Sony and Bitcoin. An interesting note on Bitcoin is that since October the digital currency has more than quadrupled its value to now stand at $675.
In the ETF markets, all sectors except industrials closed out the day in the negative. However, this is not reflective of the spectacular overall Q4 performance that ETFs have shown. Thus far in Q4, all sectors have realized gains greater than 5%, with consumer staples (XLP) leading the pack at 8.54%. As ETFs have been basking in the sunshine of the S&P’s glory this year, one can only stay optimistic as the index continues to perform.
Let’s head over to our ETFs in the spotlight:
2. ETFs in the Spotlight
In case you missed the announcement and description of this section, you can read it here again.
It features 10 broadly diversified ETFs from my HighVolume list as posted every Monday. Furthermore, they are screened for the lowest MaxDD% number meaning they have been showing better resistance to temporary sell offs than all others over the past year.
In other words, all of them never triggered their 7.5% sell stop level during this time period, which included a variety of severe market pullbacks but no move into outright bear market territory.
Here are the 10 candidates:

All of them are in “buy” mode meaning their prices are above their respective long term trend lines by the percentage indicated (%M/A).
Now let’s look at the MaxDD% column and review the ETF with the lowest drawdown as an example. As you can see, that would be XLY with the lowest MaxDD% number of -5.73%, which occurred on 11/15/2012.
The recent sell off in the month of June did not affect XLY at all as its “worst” MaxDD% of -5.73% still stands since the November 2012 sell off.
A quick glance at the last column showing the date of occurrences confirms that five of these ETFs had their worst drawdown in November 2012, while the other five were affected by the June 2013 swoon, however, none of them dipped below their -7.5% sell stop.
Year to date, here’s how the above candidates have fared so far:

3. Domestic Trend Tracking Indexes (TTIs)
Our Trend Tracking Indexes (TTIs) showed a mixed picture as the Domestic TTI dropped a tad while the International TTI closed slightly higher.
Domestic TTI: +4.68% (previous +4.79%)
International TTI: +7.73% (previous +7.59%)
Disclosure: I am obliged to inform you that I, as well as advisory clients of mine, own some of these listed ETFs. Furthermore, they do not represent a specific investment recommendation for you, they merely show which ETFs from the universe I track are falling within the guidelines specified.
Contact Ulli
Comments 2
Hi Ulli:
Your comments on VOO please’
Best, John B.
John,
Hmm, I am not sure what to comment on. It’s a different ETF representing the S&P 500 index, and it tracks SPY exactly. Personally, I prefer SPY due to its higher volume.
Ulli…