 The short answer is: To some degree and in certain cases. Why bring it up?
A client e-mailed me this past weekend because he noticed a phenomenon on the domestic Trend Tracking chart (TTI). Since he is very much interested in technical analysis he observed that, a few weeks ago, the TTI “gapped” to the upside. Could that have any significance on future market behavior?
What does he mean? Take a look at the weekly TTI chart below:
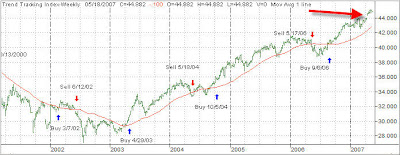
Notice the red arrow pointing at an area where the chart shows a gap. That was caused by the highest price of the previous week being lower than the lowest price of the following week thereby creating a gap. Here’s a section of the chart detailing what I mean:
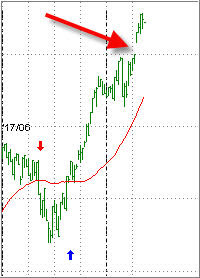
If you look at this chart, or any chart for that matter, you’ll find upside breakaway gaps occurring on extremely bullish sentiment, where the markets simply open higher and never look back. The opposite is true on the downside, where a breakaway gap identifies extreme weakness.
Having looked at thousands of charts over the past 25 years, I have to concur with what technical analysts are saying: Breakaway gaps will always be closed. That means that prices will eventually come back down to “close” the gap.
This is not a timing indicator, because you don’t know when it will occur, but it will happen. Prices may decline to a point slightly below the beginning of the gap (and rebound), or go past it.
While this is an interesting phenomenon, it has no effect on my decision making process. However, when the markets retreat, this point may very well coincide with some of my trailing stop losses.
Knowing that this occurs with regularity, let’s re-visit the above TTI chart in the future to see if the theory of the closing of the gap can be confirmed.
Contact Ulli

 The short answer is: To some degree and in certain cases. Why bring it up?

Comments 2
Ulli,
After looking over your chart of this “gap” I decided to take a look at the same period on my own TTIs and something interesting came up.
The “gap”, which I believe occured from close Friday, Apr. 13 to open Monday Apr. 16, represents the day that all domestic equities exceeded the previous highs set on Feb. 20. just before the correction period.
I maintain TTIs for domestic Large-Caps, domestic Small/Medium Caps, and all the major domestic indexes and each of these three TTIs showed the same condition. The “gap” occured in conjuction with the day each TTI crossed the previous high, prior to the correction.
Because of the resolution of your charts I’m unable to see if this relationship holds true for your index. But due to the consistancy across all three of my domestic index TTIs I felt it was more than coincidence.
BTW, this condition did not hold true for my International or Sector TTIs, which makes sense to me due to the greater rate of return of internat’s and the volatility of sectors.
Maybe it means nothing, or maybe it is worth noting, but I felt it was worth sharing.
G.H.
G.H.
Glad to hear you noticed it too. I only bought this up to make readers more aware that this phenomenon exists.
You are correct; the international chart did not show a gap, although I have no interpretation as to why not—and it really does not matter.
Ulli…