03-09-2012

Ulli Newsletter Archives Contact

ETF/No Load Fund Tracker Newsletter For Friday, March 9, 2012

ETF/No Load Fund Tracker StatSheet

————————————————————-

THE LINK TO OUR CURRENT ETF/MUTUAL FUND STATSHEET IS:

https://theetfbully.com/2012/03/weekly-statsheet-for-the-etfno-load-fund-tracker-newsletter-updated-through-03082012/

————————————————————

Market Commentary

Friday, March 9, 2012

EQUITY ETFs PUSH HIGHER ON STRONG JOBS DATA; REMX UP AS MATERIALS GAIN, VXX TUMBLES

U.S. stocks closed higher for the third straight session on Friday after a stronger-than-expected monthly jobs report confirmed a recovery that’s gaining momentum.

Gains were trimmed in late trading after Greece’s debt-swap deal was announced a “credit event” since Athens exercised the so-called collective action clause (CAC) forcing some creditors to accept losses.

The Dow Jones Industrial Average (DJIA) was up 0.1 percent to 12,922.02, with 20 out of 30 components advancing while the S&P 500 Index (SPX) advanced 0.4 percent to 1370.87, eking out its fourth weekly gain.

Treasuries ended up lower for the week as U.S. payrolls beat analysts’ expectations, adding 227,000 non-farm jobs for the third consecutive month. This fueled speculations of the Fed pausing monetary stimulus as growth gains pace. 10-year note yields hit the highest weekly level as risk sentiments improved after Athens announced it has reached its target for the biggest sovereign debt restructuring in history.

ETFs in the news:

Market correlated sectors like minerals are doing well as stock indexes continue to rise. The Market Vectors Rare Earth/Strategic Metals ETF (REMX) emerged the day’s top-performer, adding 4.77 percent on the day. Other producer linked ETFs like SPDR S&P Metals & Mining ETF (XME) also performed well on the winner’s list.

The iShares Dow Jones U.S. Home Construction Index Fund (ITB) is back with a bang after struggling for weeks, adding 2.82 percent for the day. It has hit new 2012 highs after the past three days of gains.

The Guggenheim Solar ETF (TAN) added 2.85 percent on the day, its second day of gains, after suffering six days of downturn.

Among the day’s top losers, the fear-tracking iPath S&P 500 VIX Short Term Futures ETN (VXX) shed 1.93 percent as markets surged for the third straight day.

The iPath Dow Jones UBS Natural Gas Subindex Total Return ETN (GAZ) slipped 0.19 percent as high premium continues to weigh the product down.

Oil for April delivery surged 82 cents to $107.40 a barrel and Gold futures for April delivery ended $12.80 higher at $1,683.90 an ounce.

Our Trend Tracking Indexes (TTIs) remain on the bullish side of the trend line with the Domestic TTI hovering at +5.23 percent and the International TTI at +4.73%.

Have a great week.

Ulli…

Disclosure: No holdings

————————————————————-

READER Q & A FOR THE WEEK

All Reader Q & A’s are listed at our web site!
Check it out at:

http://www.successful-investment.com/q&a.php

A note from reader Mike:

Q: Ulli: I just subscribed to your newsletter and have been reading your site and archives with interest.
I am very interested in your Aggressive ETF Growth Portfolio.  I have accounts at Scottrade and Fidelity, so I’m able to purchase the ETF’s in the portfolio. What I don’t understand is when and what to buy or sell. Would you please point me in the right direction?

A: Mike: No problem. The what to buy is the easy answer as all ETFs are listed in the model portfolios. You should buy the domestic ETFs/bonds when our Domestic Trend Tracking Index (TTI) is in bullish territory, which it is.

The total amount of the investment is determined by your risk tolerance. I have a short video on that topic on my blog. Notice my welcome video on the right; then scroll down past the first ad and view the risk tolerance video.

Just because the market is in bullish territory does not mean it will stay there. So you need to protect yourself via trailing sell stops just as the matrix in the model portfolio shows. For domestic ETFs, I use 7%, for sector/country ETFs, I use 10% and for Bond ETF, I recommend 5%.

———————————————————-

WOULD YOU LIKE TO HAVE YOUR INVESTMENTS PROFESSIONALLY MANAGED?

Do you have the time to follow our investment plans yourself? If you are a busy professional who would like to have his portfolio managed using our methodology, please contact me directly or get more details at:

https://theetfbully.com/personal-investment-management/

———————————————————

Back issues of the ETF/No Load Fund Tracker are available on the web at:
https://theetfbully.com/newsletter-archives/

ETF/No Load Fund Tracker Newsletter For Friday, March 9, 2012

Ulli ETF Tracker Contact

ETF/No Load Fund Tracker StatSheet

————————————————————-

THE LINK TO OUR CURRENT ETF/MUTUAL FUND STATSHEET IS:

https://theetfbully.com/2012/03/weekly-statsheet-for-the-etfno-load-fund-tracker-newsletter-updated-through-03082012/

————————————————————

Market Commentary

Friday, March 9, 2012

EQUITY ETFs PUSH HIGHER ON STRONG JOBS DATA; REMX UP AS MATERIALS GAIN, VXX TUMBLES

U.S. stocks closed higher for the third straight session on Friday after a stronger-than-expected monthly jobs report confirmed a recovery that’s gaining momentum.

Gains were trimmed in late trading after Greece’s debt-swap deal was announced a “credit event” since Athens exercised the so-called collective action clause (CAC) forcing some creditors to accept losses.

The Dow Jones Industrial Average (DJIA) was up 0.1 percent to 12,922.02, with 20 out of 30 components advancing while the S&P 500 Index (SPX) advanced 0.4 percent to 1370.87, eking out its fourth weekly gain.

Read More

Weekly StatSheet For The ETF/No Load Fund Tracker Newsletter – Updated Through 03/08/2012

Ulli ETF StatSheet Contact

ETF/Mutual Fund Data updated through Thursday, March 8, 2012

If you are not familiar with some of the terminology used, please see the Glossary of Terms.


1. DOMESTIC EQUITY MUTUAL FUNDS/ETFs: BUY — since 10/25/2011

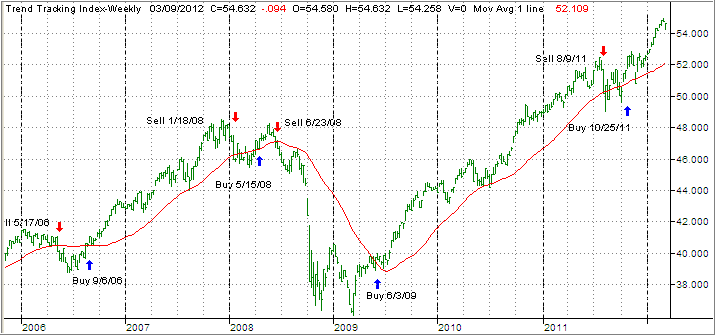
The domestic TTI broke through its long-term trend line generating a Sell for this area effective 8/9/2011. Over the recent past, we’ve seen the TTI hovering slightly below and above this dividing line between bullish and bearish territory. The clear break to the upside occurred on 10/24/11 and, effective 10/25/11, a new Buy signal for domestic equities went into effect.

As of today, our Trend Tracking Index (TTI—green line in above chart) has broken above its long term trend line (red) by +5.04%. Be sure to tune into my blog for the latest updates.

Read More

Major Market ETFs Surge As Greece Inches Towards Debt-Swap; EWD Gains, GAZ Tanks

Ulli Market Review Contact

[Chart courtesy of MarketWatch.com]

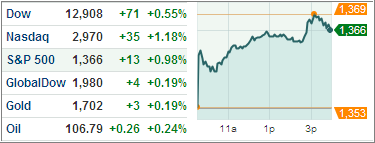
U.S. stocks surged on Thursday as the deadline for the history’s greatest sovereign debt-swap exercise, also crucial for Greece to secure the next-round of bailout money, passed.

Thursday’s deal is the (alleged) final barrier to Athens’ securing the second round of bailout money from the International Monetary Fund and the European Union to avoid a messy default weeks later. As risk appetite improved, Treasuries slumped for the second day due to weak demand for US government securities.

Yields on 10-year notes climbed 0.03 percentage points to 2.01 percent in the day’s trading while 30-year yields rose 0.04 percentage points to 3.17 percent. Ahead of tomorrow’s US payrolls data, Treasuries had briefly rallied as the Fed purchased $5.1 billion of US securities maturing between Aug. 2020 and Aug. 2021.

Read More

Strong Jobs Data Pushes Equity ETFs Up, ITB Bounces Back, VIX Tanks

Ulli Market Review Contact

[Chart courtesy of MarketWatch.com]

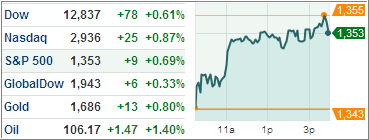
Equity ETFs made a strong comeback Thursday, recouping nearly half of previous day’s losses after latest job market data showed recovery is truly gaining traction. Sentiments improved further as news of a possible Greek PSI settlement by Thursday-deadline emerged.

Also the Fed devising a new method to keep interest rates low aimed at boosting investments helped the market. Treasuries traced back part of yesterday’s gains as risk appetite went up during the day’s trading.

The Dow Jones Industrial Average (DJIA) added 0.6 percent, to touch 12,837.33. The Dow’s 23 components out of 30 advanced.

The S&P 500 Index (SPX) rose 0.7 percent to 1352.63 with the financial and the industrial sectors leading today’s gains. Utilities however, were out-of-favor in the 10-sector index and closed lower.

The tech-heavy NASDAQ Composite (COMP) added 0.9 percent to close at 2935.69 as trading remained choppy.

Following reports appearing in the WSJ that the Fed may print more money to buy long-term Treasuries or mortgages, and borrow it back at lower rates over the short-term to curb money-supply and inflation, government bonds pared some of yesterday’s gains.

Read More

7 ETF Model Portfolios You Can Use – Updated through 3/6/2012

Ulli Model ETF Portfolios Contact

Today’s sell off pulled the S&P 500 off its lofty level. Since last week’s report, the index gave back 2.11%, while the equity portion of our portfolios headed south as well. The bond ETFs offered a nice balance so that the bottom line effect was manageable.

There’s no doubt that the major indexes have been struggling to maintain their positions at these elevated levels, as the Dow has made numerous attempts to conquer the 13k milestone. While it actually breached it, the duration was very short just as the S&P 500 has struggled with the 1,375 level.

All eyes are now on this week’s jobs report, which may very well give us a hint as to further market direction.

Take a look at the latest ETF Model Portfolio update:

Read More