Weekly StatSheet For The ETF/No Load Fund Tracker Newsletter – Updated Through 03/08/2012

Ulli ETF StatSheet Contact

ETF/Mutual Fund Data updated through Thursday, March 8, 2012

If you are not familiar with some of the terminology used, please see the Glossary of Terms.


1. DOMESTIC EQUITY MUTUAL FUNDS/ETFs: BUY — since 10/25/2011

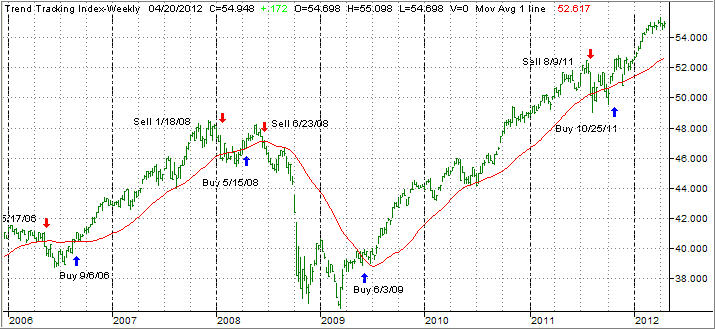
The domestic TTI broke through its long-term trend line generating a Sell for this area effective 8/9/2011. Over the recent past, we’ve seen the TTI hovering slightly below and above this dividing line between bullish and bearish territory. The clear break to the upside occurred on 10/24/11 and, effective 10/25/11, a new Buy signal for domestic equities went into effect.

As of today, our Trend Tracking Index (TTI—green line in above chart) has broken above its long term trend line (red) by +5.04%. Be sure to tune into my blog for the latest updates.

Read More

Major Market ETFs Surge As Greece Inches Towards Debt-Swap; EWD Gains, GAZ Tanks

Ulli Market Review Contact

[Chart courtesy of MarketWatch.com]

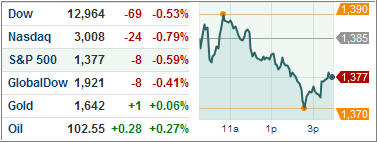
U.S. stocks surged on Thursday as the deadline for the history’s greatest sovereign debt-swap exercise, also crucial for Greece to secure the next-round of bailout money, passed.

Thursday’s deal is the (alleged) final barrier to Athens’ securing the second round of bailout money from the International Monetary Fund and the European Union to avoid a messy default weeks later. As risk appetite improved, Treasuries slumped for the second day due to weak demand for US government securities.

Yields on 10-year notes climbed 0.03 percentage points to 2.01 percent in the day’s trading while 30-year yields rose 0.04 percentage points to 3.17 percent. Ahead of tomorrow’s US payrolls data, Treasuries had briefly rallied as the Fed purchased $5.1 billion of US securities maturing between Aug. 2020 and Aug. 2021.

Read More

Strong Jobs Data Pushes Equity ETFs Up, ITB Bounces Back, VIX Tanks

Ulli Market Review Contact

[Chart courtesy of MarketWatch.com]

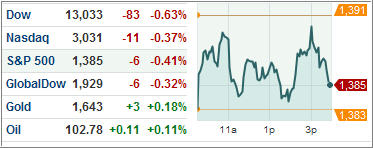
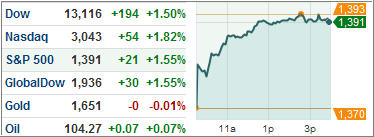
Equity ETFs made a strong comeback Thursday, recouping nearly half of previous day’s losses after latest job market data showed recovery is truly gaining traction. Sentiments improved further as news of a possible Greek PSI settlement by Thursday-deadline emerged.

Also the Fed devising a new method to keep interest rates low aimed at boosting investments helped the market. Treasuries traced back part of yesterday’s gains as risk appetite went up during the day’s trading.

The Dow Jones Industrial Average (DJIA) added 0.6 percent, to touch 12,837.33. The Dow’s 23 components out of 30 advanced.

The S&P 500 Index (SPX) rose 0.7 percent to 1352.63 with the financial and the industrial sectors leading today’s gains. Utilities however, were out-of-favor in the 10-sector index and closed lower.

The tech-heavy NASDAQ Composite (COMP) added 0.9 percent to close at 2935.69 as trading remained choppy.

Following reports appearing in the WSJ that the Fed may print more money to buy long-term Treasuries or mortgages, and borrow it back at lower rates over the short-term to curb money-supply and inflation, government bonds pared some of yesterday’s gains.

Read More

7 ETF Model Portfolios You Can Use – Updated through 3/6/2012

Ulli Model ETF Portfolios Contact

Today’s sell off pulled the S&P 500 off its lofty level. Since last week’s report, the index gave back 2.11%, while the equity portion of our portfolios headed south as well. The bond ETFs offered a nice balance so that the bottom line effect was manageable.

There’s no doubt that the major indexes have been struggling to maintain their positions at these elevated levels, as the Dow has made numerous attempts to conquer the 13k milestone. While it actually breached it, the duration was very short just as the S&P 500 has struggled with the 1,375 level.

All eyes are now on this week’s jobs report, which may very well give us a hint as to further market direction.

Take a look at the latest ETF Model Portfolio update:

Read More

Dow Witnesses Biggest Fall In Three Months; VXX Soars On Higher Volatility, ERUS Sinks

Ulli Market Review Contact

[Chart courtesy of MarketWatch.com]

U.S. stocks suffered their biggest drop this year on Tuesday as fears of a disorderly Greek default loomed large.

The DJIA sank by more than 200 points after the US markets witnessed a sell-off following weak economic data from Europe and rising yields on EZ government bonds. As Greece struggles to meet Thursday’s deadline to convince private sector lenders agree to higher haircuts on their bond-holdings, many investors chose to rebalance their portfolios ahead of the cut-off date.

The Dow lost 1.5 percent to close at 12,759, its biggest drop since Dec. 8, when it sank 1.6 percent. The S&P 500 dropped 1.5 percent to 1343.36, its worst day since Dec. 8 and the third straight day of losses. The tech-laden NASDAQ Composite lost 1.4 percent to end at 2,910.32, also its highest percentage drop since December 8.

Read More

U.S. Stocks Decline Despite Rising Service-Sector Index; GAZ Burns Bright, KWT Slumps

Ulli Market Review Contact

[Chart courtesy of MarketWatch.com]

U.S. stocks ended lower Monday despite the service-sector gauge advancing in February. The Institute for Supply Management’s non-manufacturing index came in better-than-expected. However, its employment index dropped, while the inflation-measuring price index jumped in January.

Not helping the markets were the Chinese lowest growth target in eight years for 2012 and a survey that showed a shrinking European economic activity.

The Dow Jones Industrial Average shed 0.1 percent while the S&P 500 (SPX) lost 0.4 percent after natural resources retreated and consumer staples advanced. The tech-laden NASDAQ Composite was leading to the downside by dropping 0.9 percent.

Treasuries fell after U.S. service industries’ index recorded its fastest growth in a year, reinforcing the domestic recovery theory.

Read More