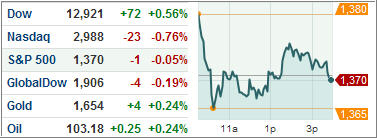
US equities ended mixed Monday despite higher corporate earnings and better-than-estimated retail sales boosting sentiments as investors weighed US economic data with a contagion possibility in Europe.
Heavy selling in the tech area more than offset a rebound in blue-chip stocks, dragging the major US indices down. Yield on benchmark 10-year Treasuries consolidated below the 2-percent mark for the second straight day as risk was off on mounting speculations of a deepening European debt crisis.
The Dow Jones Industrial Average (DJIA) jumped 71.82 points, flirting with the 13K mark but was unable to breach it. The Commerce Department said retail sales rose 0.8 percent in March ahead of the day’s opening bell, beating analysts’ expectation of 0.3 percent.
However, a separate report showed manufacturing activity in the New York region expanded at the slowest pace in five months, spooking investors.
Below are the latest ETF Cutline reports, which show how far above or below their respective long-term trend lines (39 week SMA) my currently tracked ETFs/MFs are positioned.
The first report covers the ETF Master List from Thursday’s StatSheet and includes 398 ETFs, of which currently 316 (last week 326) of them are hovering in bullish territory.
The second report includes only High Volume ETFs. To clarify, High Volume (HV) ETFs are defined as those with an average daily volume of $10 million or higher.
These ETFs are generated from my selected list of some 93 that I use in my advisor practice. It cuts out the “noise,” which simply means it eliminates those ETFs that I would never buy because of their volume limitations. 60 ETFs (last week 64) have managed to move into in bullish territory after the recent run up.
The third report covers Mutual Funds on the Cutline. There are currently 785 (last week 794) above the line and 76 below it out of the 861 that I follow.
In case you missed it, here’s a summary of the ETF topics and market reviews I posted to my blog during the week ending on 4/15/2012.
Disappointment from the jobs report did indeed affect last Monday’s trading, as the spillover effect kicked in and took the starch out of any remaining upward momentum.
Despite the 2-day rally on Wednesday and Thursday, negative sentiment, along with Europe’s debt crisis moving back onto the front burner, were simply too much for the bulls to overcome. Friday’s close of the major indexes at the low levels for the day may not bode well for Monday’s opening.
The latest US jobs data has brought the bears out in full force. And Gary Shilling, president of A. Gary & Co, is certainly no exception. Gary thinks the US recovery has primarily been driven by consumer spending as there has been a mini spending spree over the last few months.
Though incomes rose slower than expenses, it looked earlier jobs were picking up and that would provide the economy the boost it required. However, the recent employment data throws cold water on the consumer-spending driven recovery theory. The consumers have now more reasons to save than to spend; they need to build their assets since their equity in homes has fallen and people need to save for retirement. So if consumers retrench, there are not too many things that can hold the US economy up.
Mutual funds behemoth PIMCO created quite a flutter at the beginning of March when it announced launching the ETF version of its Total Return Fund, now trading under the ticker symbol BOND. The fund had generated a lot of interest from the investor community, securing $340 million in assets in the first month of its launch.
Despite its relatively higher charge – it has an expense ratio of 55 basis points – nearly 200,000 shares change hands daily. There were also reservations that the fund will not be able to replicate the performance of its fabled MF peer, as front running by smaller traders would have put the behemoth at a disadvantage since ETFs are required to update positions on a daily basis. Also Gross couldn’t use derivatives that he has so successfully employed in the mutual fund versions.
US Stocks Fall On China Slowdown And Europe Worries; GAZ Rises, EWI Sinks
Following a two-day rally, US stocks retreated Friday with the broad market indices posting their biggest loss this year on European debt-crisis rumors and a lower-than-anticipated China GDP growth report.
Treasuries advanced, pushing 10-year yields below the 2 percent mark over speculations of a deteriorating Spanish economy following reports that the borrowings by the country’s banks zoomed last month.
For a tongue in cheek version of all that ails Europe, please take a look at the following video:
The Dow Jones Industrial Average (DJIA) slid 1.1 percent to end the week at 12,849.59; lower by 1.6 percent over last week’s close.
The S&P 500 Index (SPX) dropped 1.3 percent to 1370.26, off 2 percent from the prior week’s close, with financials and technology faring the worst and consumer staples and utilities performing the best.
The NASDAQ Composite (COMP) slipped 1.5 percent to finish at 3011.33, down 3 percent from the prior week.
US 10-year Treasuries advanced for the fourth week in a row, the longest stretch of gains since August. Treasuries pushed higher after China’s lower-than-forecast economic growth fuelled speculations of a global slowdown.
Benchmark yield on 10-year Treasuries dropped by 0.06 percentage points to settle at 1.99 percent. 30-year bond yield dropped six basis points to close at 3.15 percent for the week.
ETFs in the news:
The iPath S&P 500 VIX Short Term Futures ETN (VXX) rebounded by adding about 5.35 percent after tumbling 8 percent Thursday. Slowing Chinese growth and European debt worries triggered a sell-off today, driving the so-called fear-tracking VIX index higher.
The iPath Dow Jones UBS Natural Gas Subindex Total Return ETN (GAZ) soared Friday and added 7.47 percent despite energy and natural resource related stocks coming under pressure. GAZ’s rise can be attributed to its high premium, currently standing at over 100 percent.
As markets continue to slide, and investors increasingly seek refuge in safe haven assets, the iShares Barclays 20+ Year Treasury Index Fund (TLT) gained 1.62 percent as equities got pounded. TLT has managed to maintain its momentum after rallying through its 50-day moving average.
Among the day’s biggest losers, the iShares MSCI Italy Index Fund (EWI) shed 3.81 percent, as sovereign Italian yields continue to soar and European equities come under renewed pressure. There is bound to be more fallout next week as the realization sets it that added liquidity does not help insolvent institutions in the long run.
The PowerShares India Portfolio (PIN) slumped 4.15 percent as emerging markets lost favor with investors because of higher inherent risk perceptions.
The Market Vectors Solar Energy ETF (KWT) dropped 3.68 percent Friday, ending a long-streak of winning sessions. If you are a conservative investor, you better watch from a distance due to the fund’s high volatility.
Our Trend Tracking Indexes (TTIs) slipped from last Friday’s close, but both remain above the line and in bullish territory. Here are this week’s closing numbers:
Domestic TTI: +4.38% (last week +4.63%)
International TTI: +2.20% (last week +3.76%)
Have a great week.
Ulli…
Disclosure: Holdings in TLT
————————————————————-
READER Q & A FOR THE WEEK
All Reader Q & A’s are listed at our web site!
Check it out at:
Q: Ulli: I am a new reader. In basic terms, here is my first question. In your PDF on sell stops, you state below “when the 7% sell stop level has been broken, the “hold switches to sell”. Do you have this spreadsheet for download, or what is the formula to make the words “sell-hold” change to each position?
A: Duffy: No, you have to set up your own spreadsheet to do the tracking, just like I do in the model portfolios. You need to follow the high point your ETF has made since you bought it. That will form the basis for the sell stop calculations as mentioned before.
The formula to change from sell to hold is: =IF(N903<-7%,”Sell”,”Hold”). You need to have some spreadsheet knowledge to make that work.
———————————————————-
WOULD YOU LIKE TO HAVE YOUR INVESTMENTS PROFESSIONALLY MANAGED?
Do you have the time to follow our investment plans yourself? If you are a busy professional who would like to have his portfolio managed using our methodology, please contact me directly or get more details at: