
- Moving the market
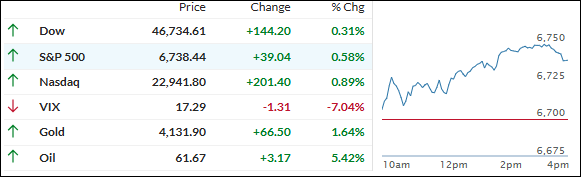
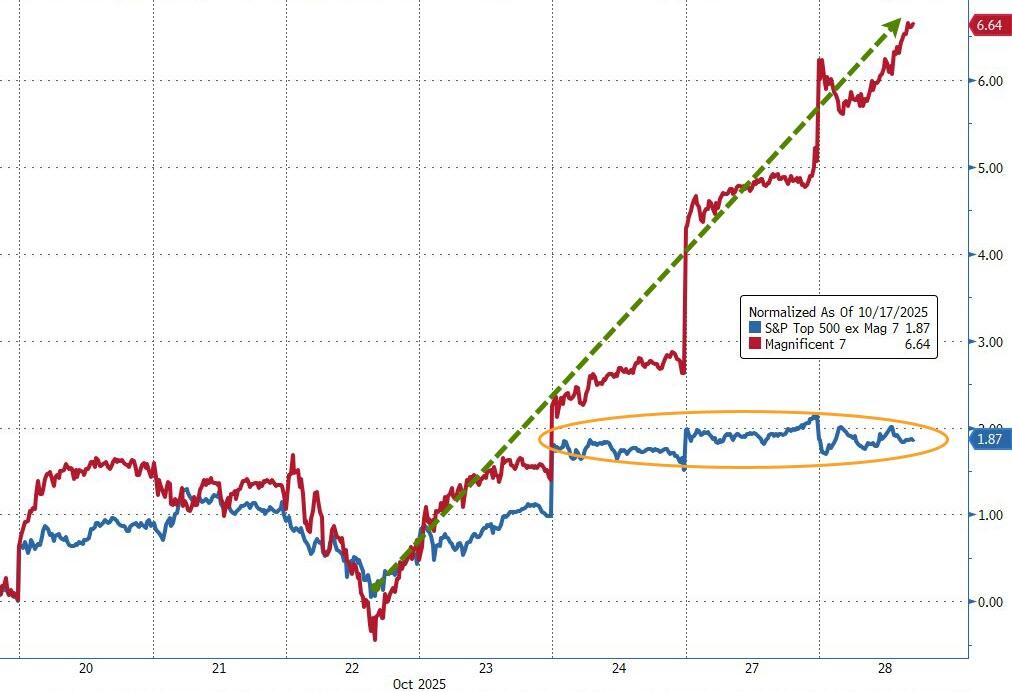
Stocks reached fresh highs Tuesday, but under the surface it was clear this was a tech-powered move—with most of the broad market sitting out the rally.
Strong earnings from big names grabbed attention: United Parcel Service jumped 7% and Wayfair soared 20% on their upbeat third-quarter results, while PayPal rallied 11% after also topping expectations.
Earnings season is proving robust so far; about one-third of S&P 500 companies have reported, and 83% are beating estimates.
The week’s focus is squarely on the “Magnificent Seven,” with Alphabet, Amazon, Apple, Meta Platforms, and Microsoft set to report in coming days—together these giants make up about a quarter of the S&P 500’s value, underscoring their outsized influence on the indexes.
Amazon stole some headlines with news of its largest round of layoffs ever, a move that fits the broader tech-industry trend of cost-cutting in 2025.
The Fed also kicked off its latest meeting, widely expected to deliver a second rate cut this year, with traders hoping Chair Jerome Powell will tee up another cut in December as labor market concerns linger.
Despite the positive action in the major averages, market breadth disappointed—350 S&P 500 stocks closed lower, and gains were concentrated entirely among the big technology names.
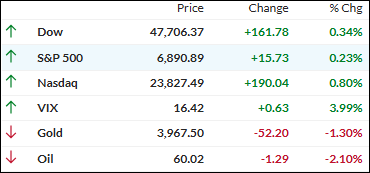
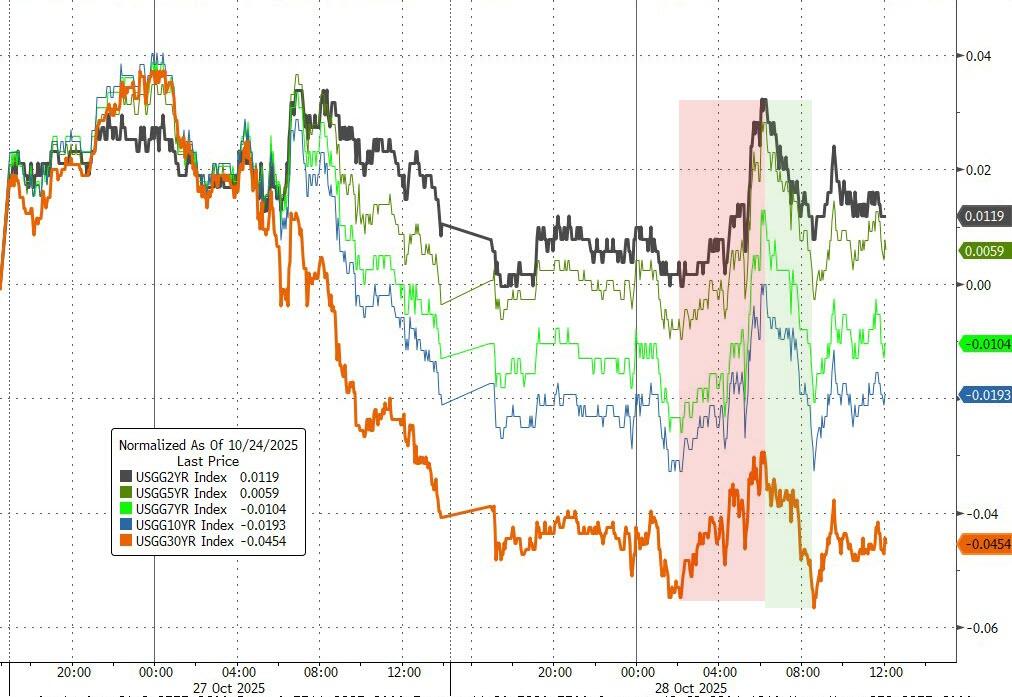
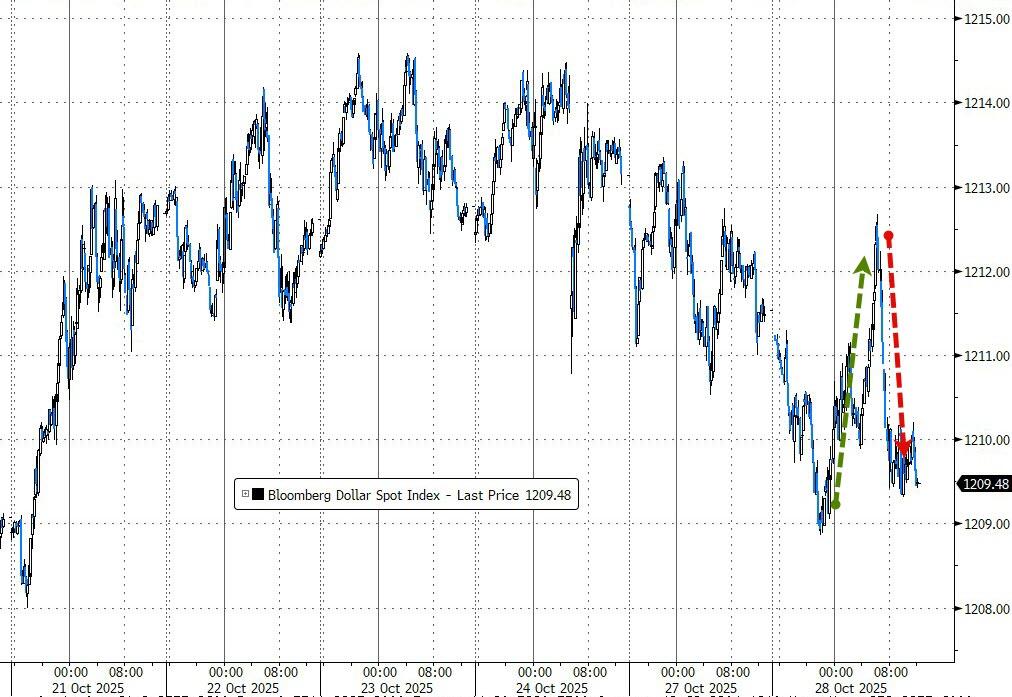
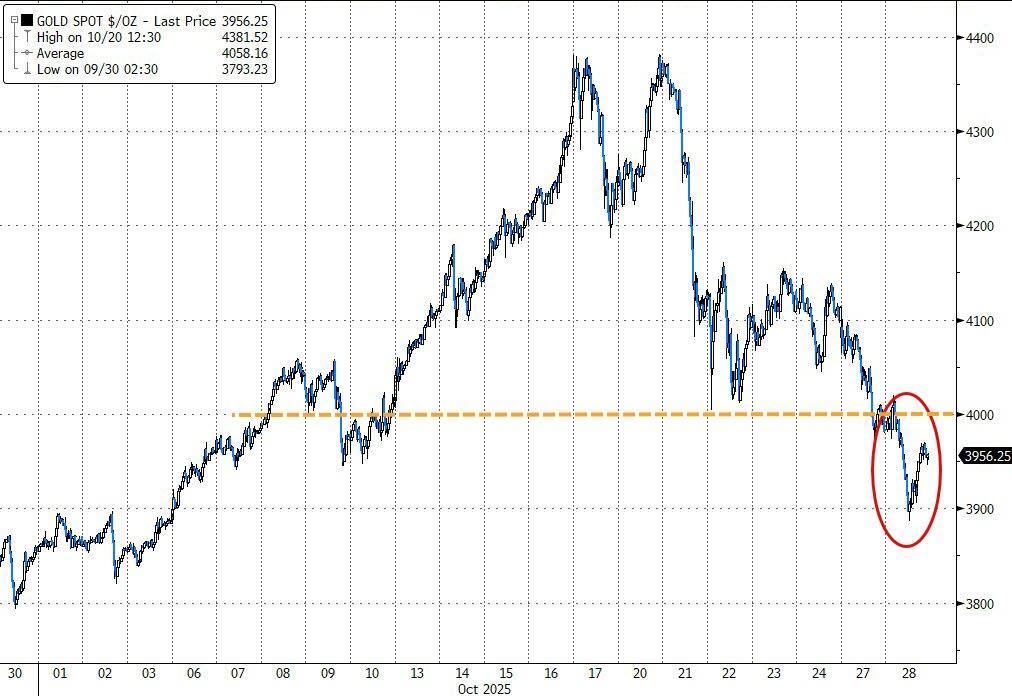
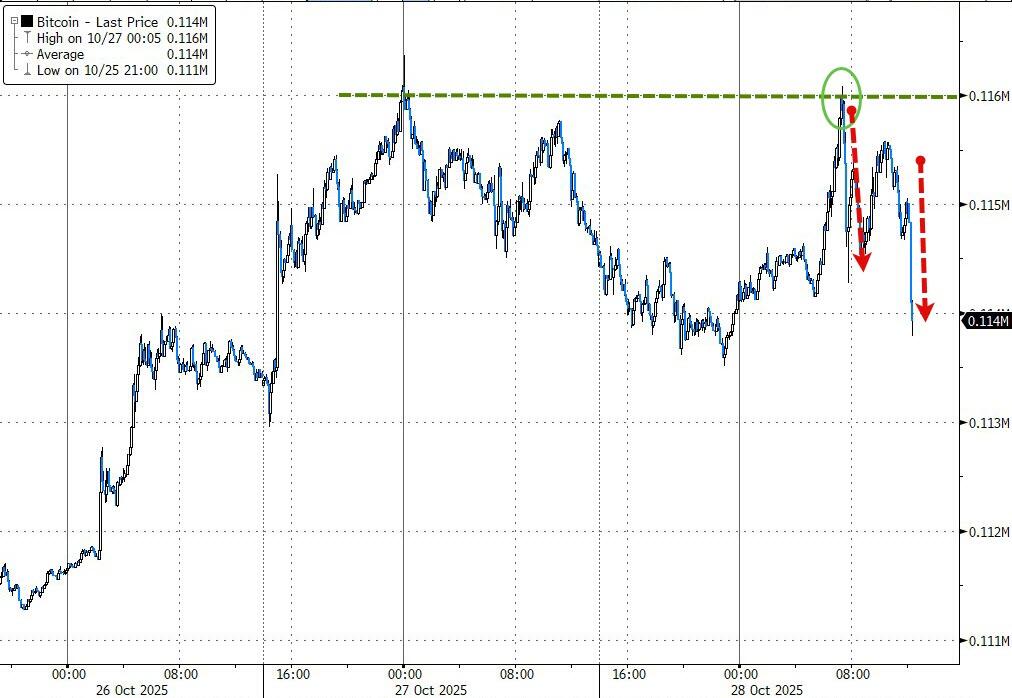
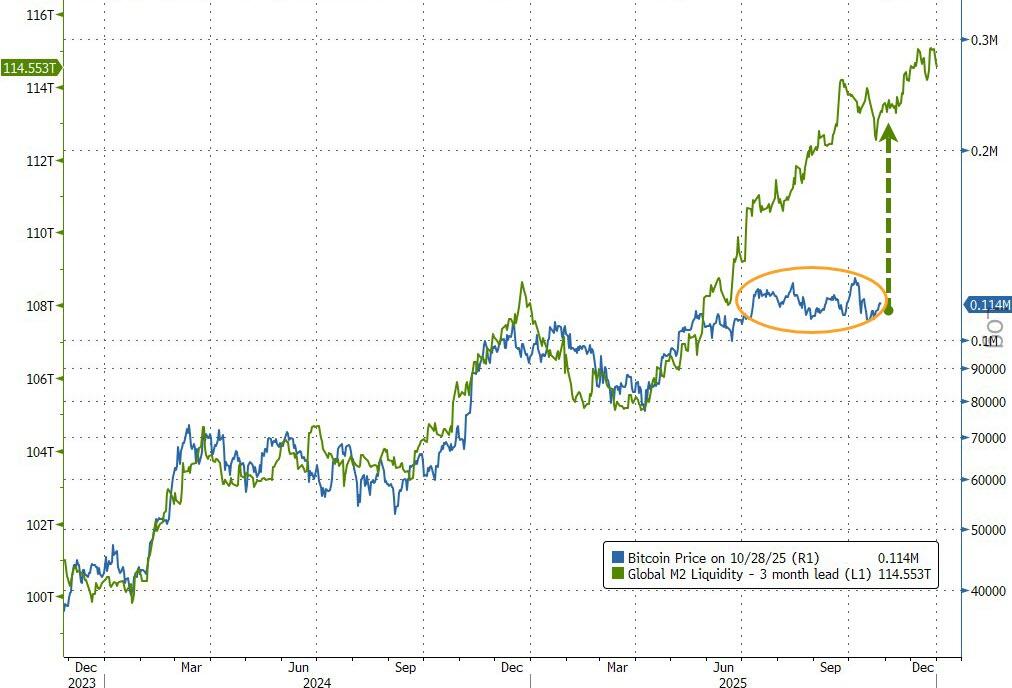
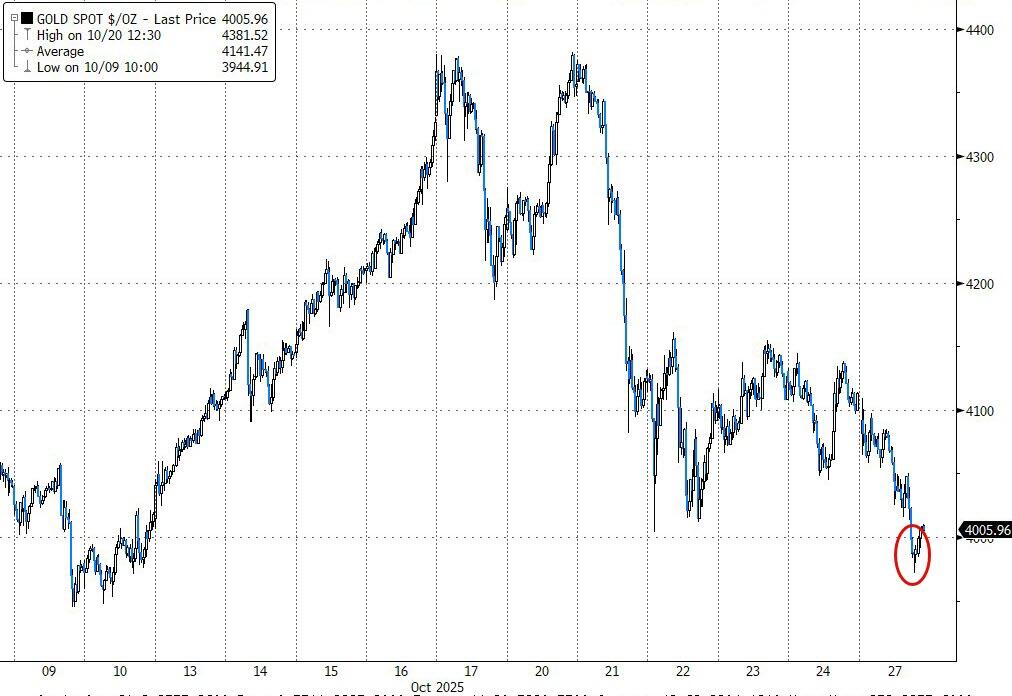
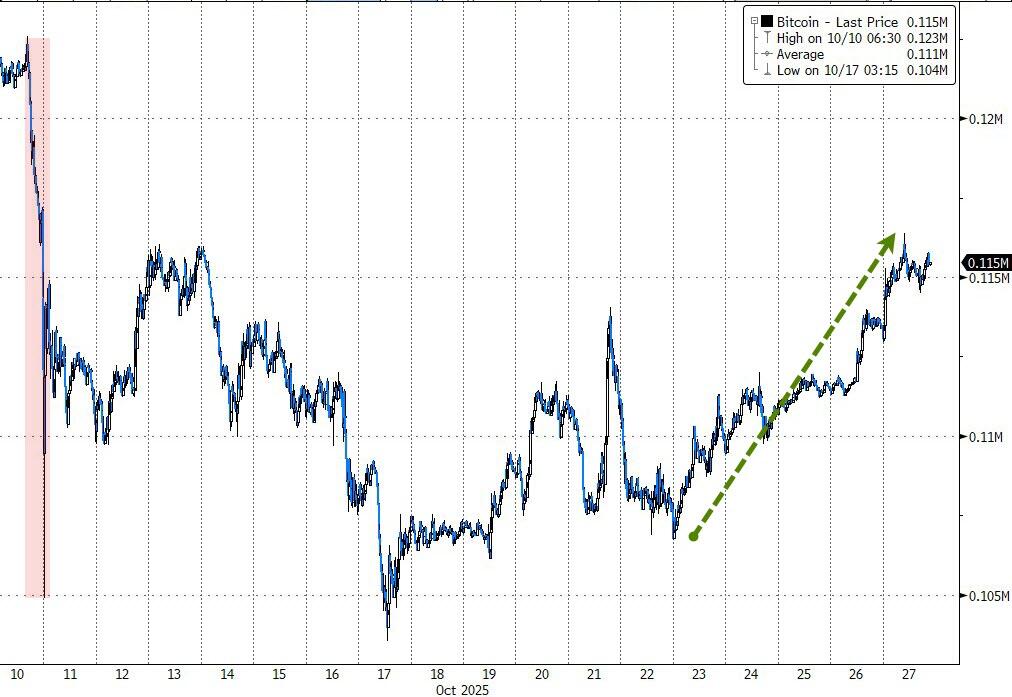
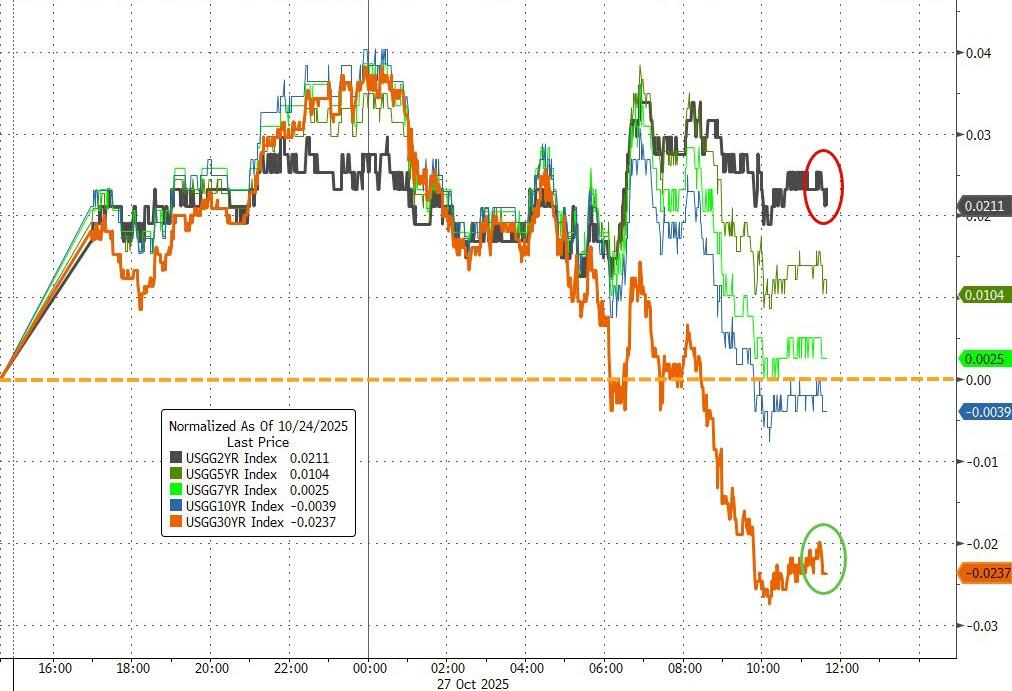
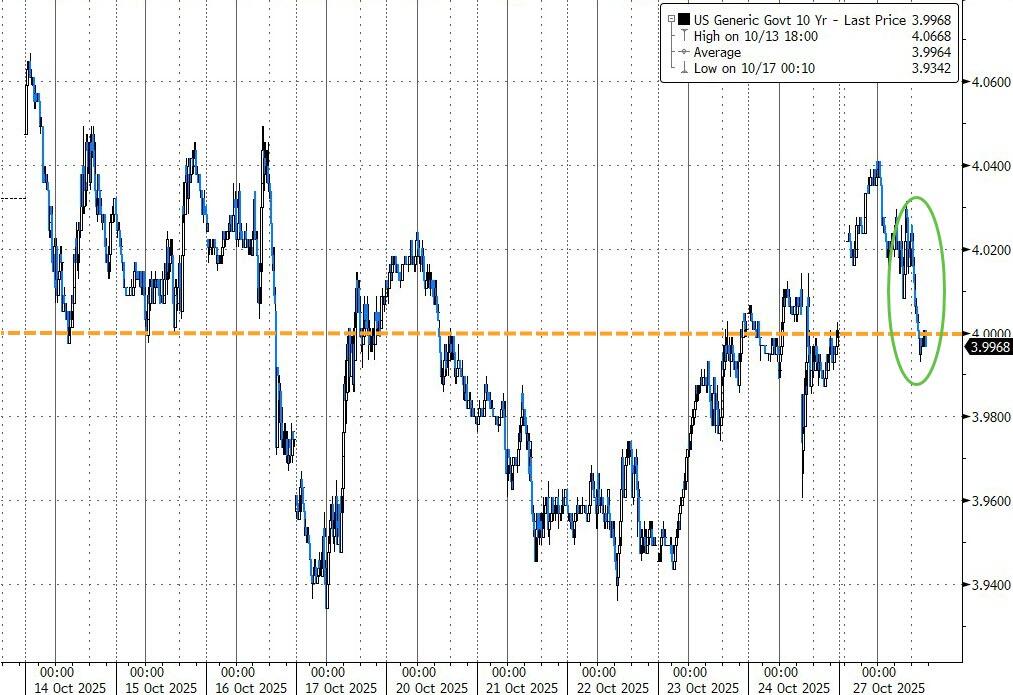
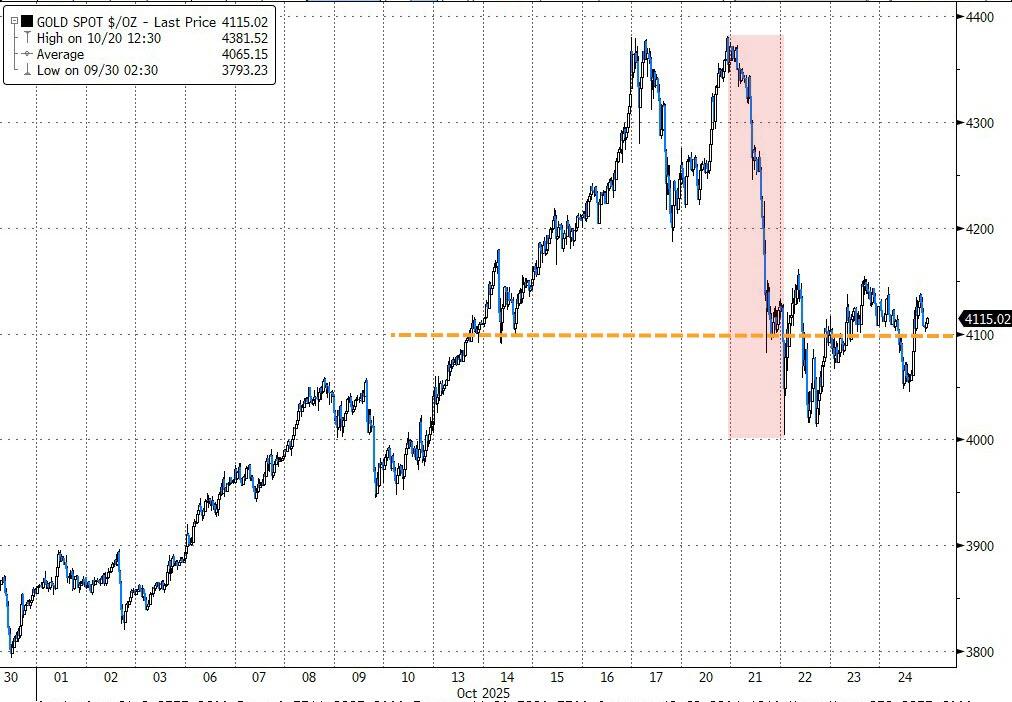
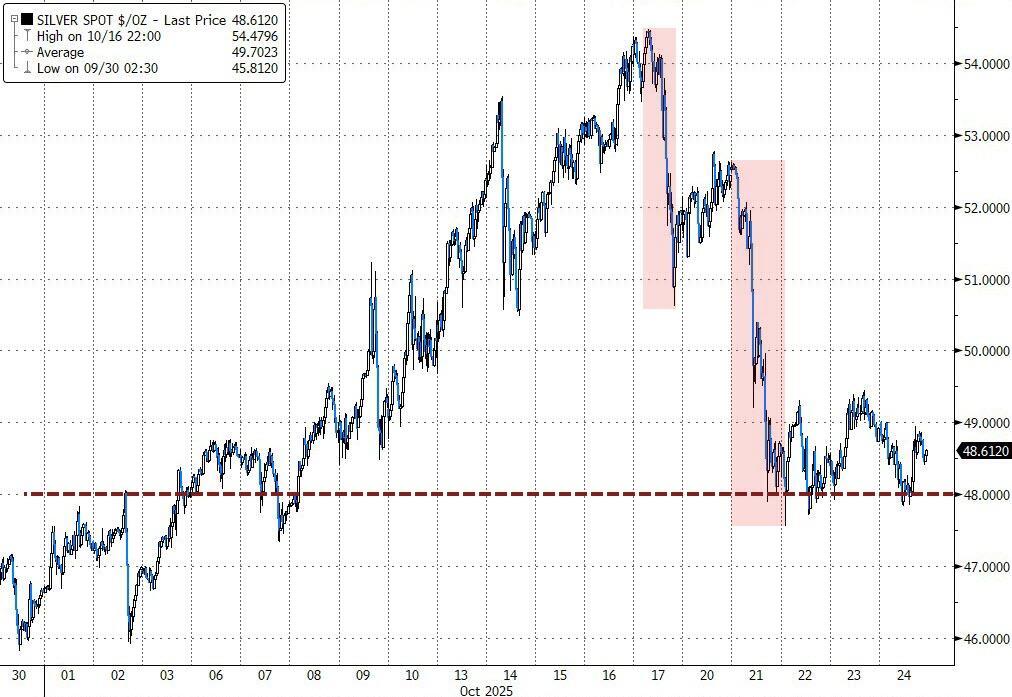
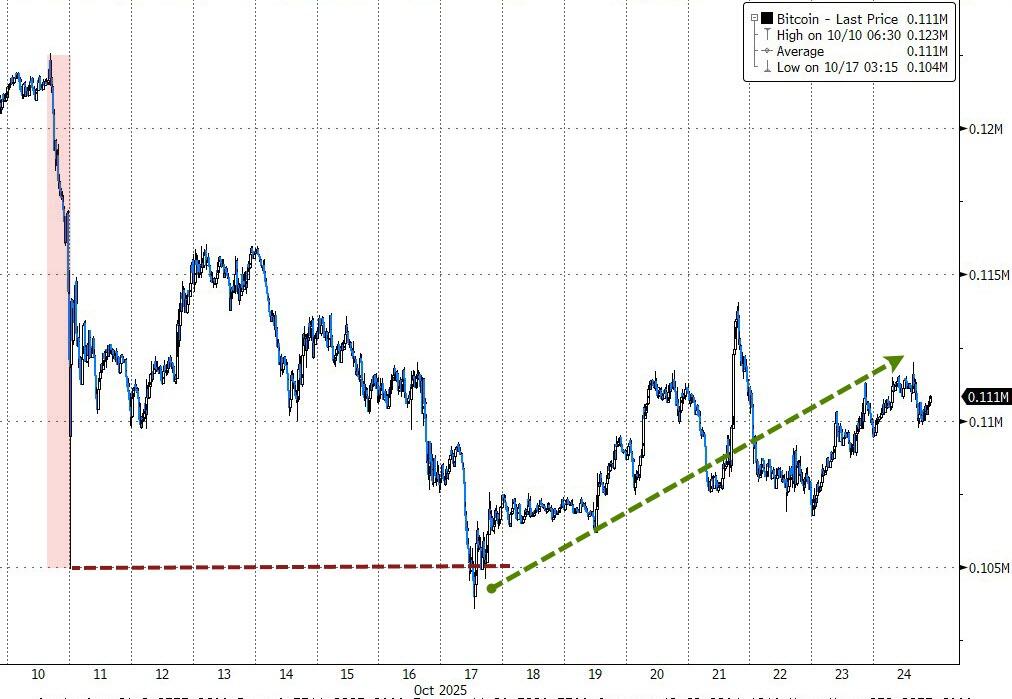
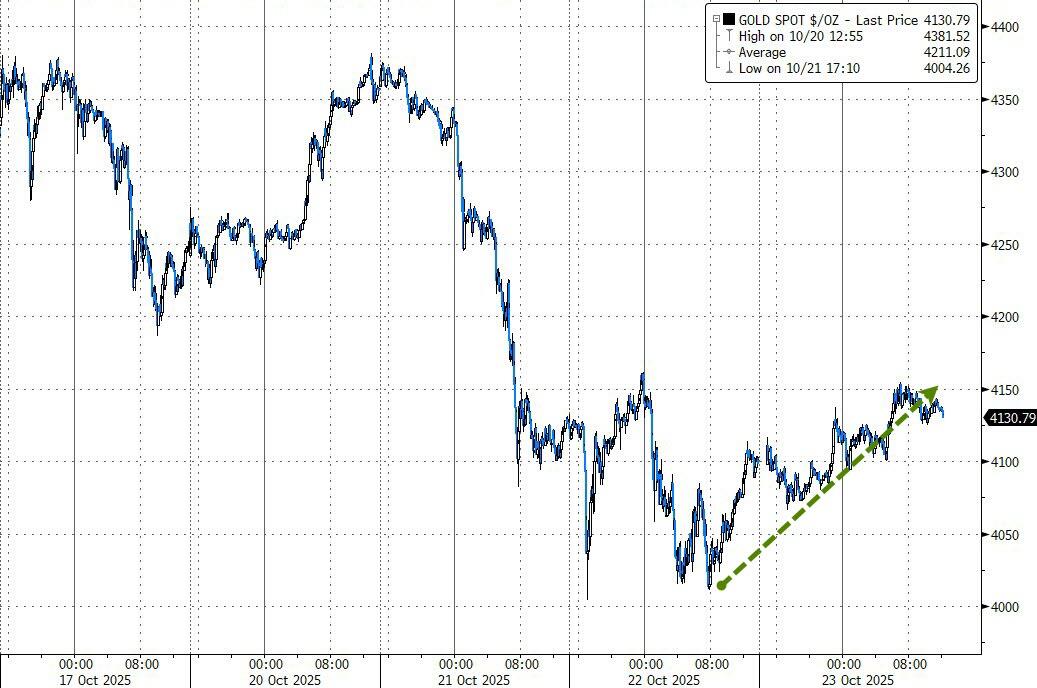
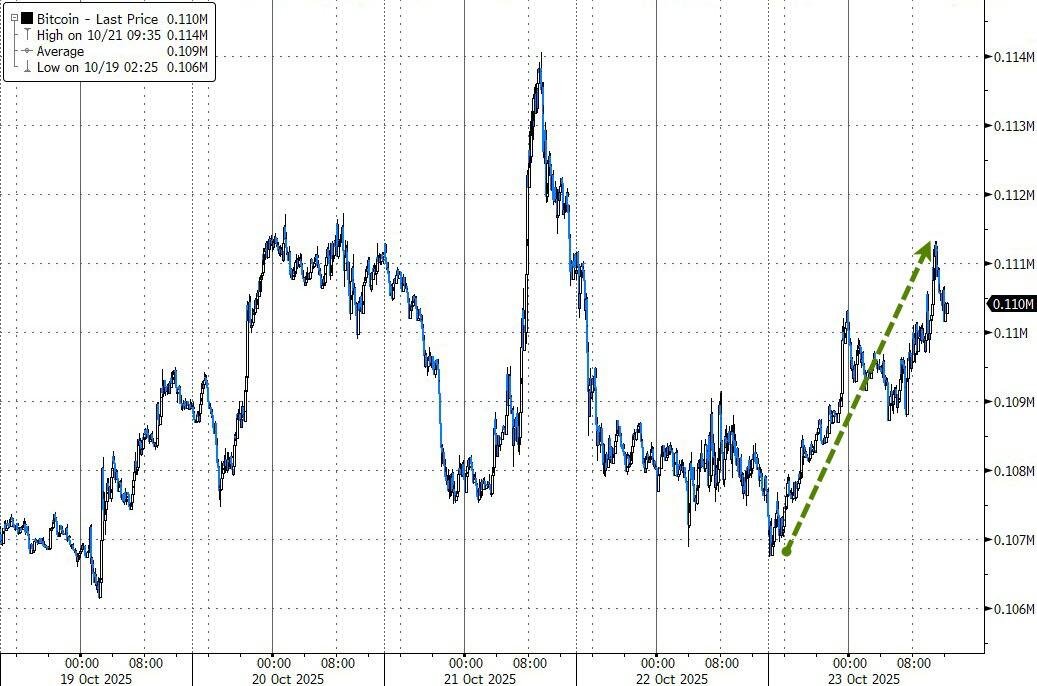
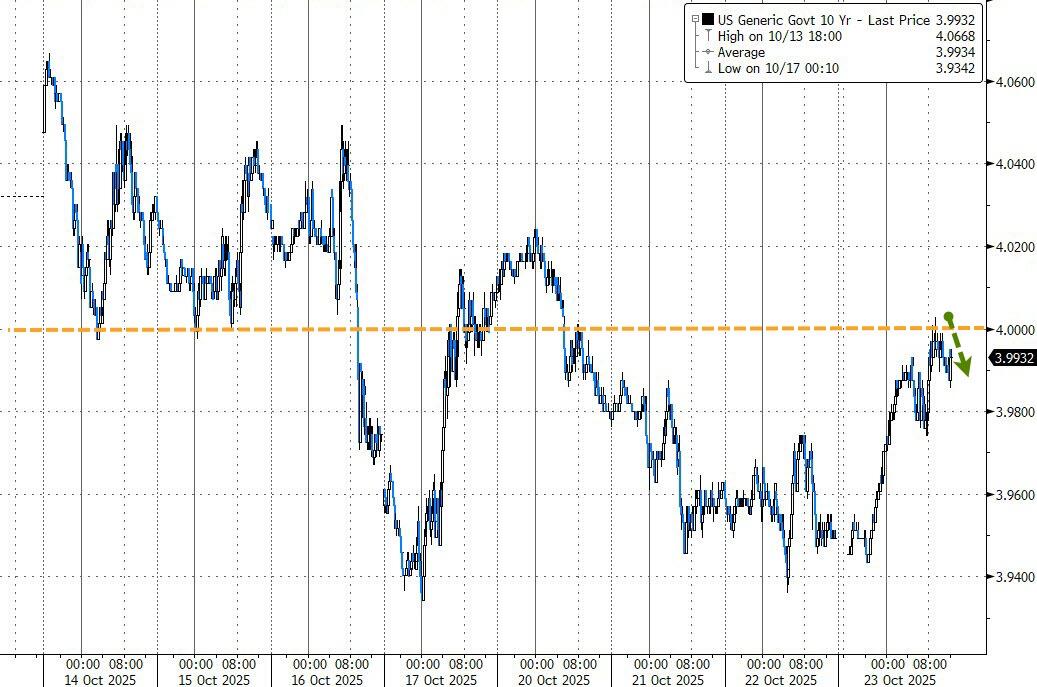
Bond yields continued to ease, the dollar fell, gold moderated, while silver found its footing and Bitcoin remained directionless.
If the Fed delivers another rate cut Wednesday, will that finally jolt bitcoin out of its sideways grind—or keep the Mag 7 doing the heavy lifting for the rally?
Read More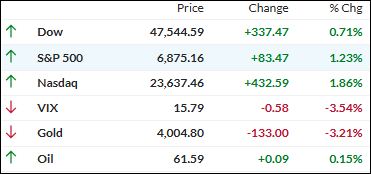

