ETF/No Load Fund Tracker Newsletter For Friday, March 8, 2013

Ulli ETF Tracker Contact

ETF/No Load Fund Tracker StatSheet

————————————————————-

THE LINK TO OUR CURRENT ETF/MUTUAL FUND STATSHEET IS:

https://theetfbully.com/2013/03/weekly-statsheet-for-the-etfno-load-fund-tracker-newsletter-updated-through-03072013/

————————————————————

Market Commentary

Friday, March 8, 2013

MARKET INDEXES GAIN MORE THAN 2 PERCENT FOR THE WEEK; EUROPE RISES ON US JOBS DATA

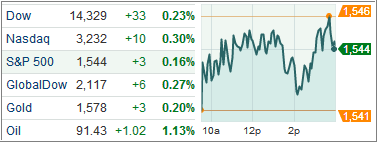
US indexes notched weekly gains of more than 2 percent as the Dow Industrials and the S&P 500 closed higher for the sixth straight trading session, after data showed employers added more jobs than forecast last month and unemployment rate fell to a four-year low.

Friday’s job report capped off a string of positive labor reports that gave investors reason to believe that the economy is finally on a firmer footing and may weather a combination of payroll tax hikes and federal spending cuts.

Labor Department report in Washington showed employment rose 236,000 last month after a downwardly revised 119,000 gain in January. Economists had forecast a job gain of about 165,000. Jobless rate fell to 7.7 percent in Feb. from 7.9 percent the month before as hiring in construction jumped the most in nearly six years.

Separately, a Commerce Department report showed inventories at the wholesale level rebounded sharply in January, rising 1.2 percent in the biggest jump since Dec 2011.

Global stocks rallied earlier after the Japanese Cabinet Office said gross domestic product expanded at an annualized 0.2 percent in the fourth quarter, bettering a preliminary estimate that showed the world’s third largest economy contracted 0.4 percent during the period.
Read More

Weekly StatSheet For The ETF/No Load Fund Tracker Newsletter – Updated Through 03/07/2013

Ulli ETF StatSheet Contact

ETF/Mutual Fund Data updated through Thursday, March 7, 2013

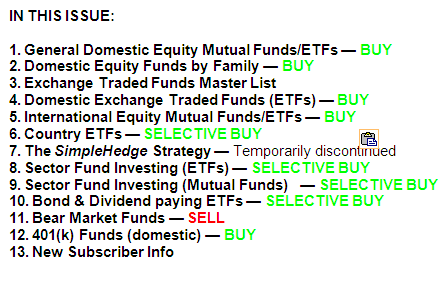
Table of Content082312

If you are not familiar with some of the terminology used, please see the Glossary of Terms.


1. DOMESTIC EQUITY MUTUAL FUNDS/ETFs: BUY — since 10/25/2011

TTI

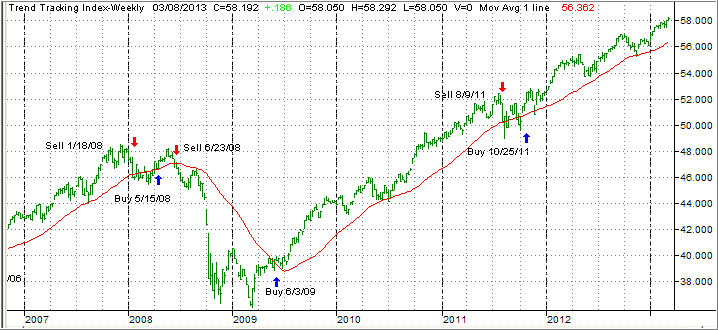
The domestic TTI broke through its long-term trend line generating a Sell for this area effective 8/9/2011. Over the recent past, we’ve seen the TTI hovering slightly below and above this dividing line between bullish and bearish territory. The clear break to the upside occurred on 10/24/11 and, effective 10/25/11, a new Buy signal for domestic equities went into effect.

As of today, our Trend Tracking Index (TTI—green line in above chart) has bounced off its long term trend line (red) by +3.43% as part of the post election rebound.

To avoid a potential whip-saw, a Sell signal to move out of all domestic equity positions will be generated once we have clearly pierced the line to the downside. Be sure to tune into my blog for the latest updates.

Read More

Dow Continues Record Run As Jobless Claims Dip; Europe Slips On ECB

Ulli Market Commentary Contact

Thur pic

[Chart courtesy of MarketWatch.com]

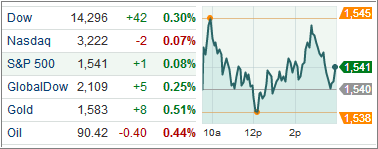
US indexes continued their upward momentum with the Dow Industrials closing at a new record high as the number of Americans who filed for unemployment benefits fell to a six-week low, showing further improvement in the labor market.

Ahead of Thursday’s open, the Labor Department said initial applications for unemployment benefits fell unexpectedly to 340,000 last week. That was down from an upwardly revised tally of 347,000 the prior week. The six-week average dropped to its lowest level since March 2008.

Another Labor Department report showed productivity of American workers dropped 1.9 percent in the fourth quarter as companies hired more and increased hours.

Separately, the trade deficit in the US widened more than forecast in January on increased demand for imported crude. The gap grew $44.4 billion from $38.1 billion in December, Commerce Department figures showed in Washington.

Read More

Dow Industrials Extend Record High On Jobs Data; Europe Retreats From 4 ½ Year High

Ulli Market Commentary Contact

Wed pic

[Chart courtesy of MarketWatch.com]

US indexes finished mostly higher with the Dow Jones Industrial Average extending its record high after a private report showed companies hired more workers than forecast and the Federal Reserve said the economy is growing.

Ahead of the opening bell, a report by Automatic Data Processing Inc. showed US companies added 198,000 workers in February, exceeding median estimates of a 170,000 rise. The upbeat data followed a revised 215,000 gain in the prior month from an earlier estimate of 192,000.

Separately, a Commerce Department report showed orders for US factories fell the most in five months in Jan., weighed down by a weak appetite for military hardware and commercial aircraft.

The US economy continues to grow at a modest to moderate pace across the country amid rising demand for homes and automobiles, the Federal Reserve said in its Beige Book survey, an analysis and summary of economic conditions in 12 US districts. Fed Chairman Ben Bernanke described the job market as generally weak in his testimony to a senate committee on Feb. 26.

Read More

7 ETF Model Portfolios You Can Use – Updated through 3/5/2013

Ulli Model ETF Portfolios Contact

After the previous week’s knockdown, it was up, up and away as the reasons for the pullback vanished into thin air with the S&P 500 adding some +2.9% recouping all losses and then some. The Dow finally took out its 2007 high, which I commented on yesterday.

It seems like it’s a one way street into bubble territory with equities supported by the Fed’s reckless money printing efforts. Nothing else matters, so let me be the voice of reason. While this rally may go on for a while, it will end badly, unless economic fundamentals match up with current market levels; after al, they are the drivers of the stock market, at least they were prior to the market distortion via the Fed’s QE efforts.

If you want to participate in this equity orgy, there are three things you need to consider to protect your portfolio:

1. Invest only in the most liquid ETFs, such as I recommend in my HighVolume ETF list. When the inevitable trend reversal occurs, the exit doors will get very crowded very quickly and low volume products will produce much more slippage in price.

2. Select ETFs that are low in volatility so that a sudden pullback does not stop you out right away. Good candidates, which we own, are SPLV, XLP and DVY just to name a few.

3. Only invest if you are using a trailing sell stop to control downside risk.

In the meantime, here’s the latest update for our Model ETF Portfolios:

Read More

Heading Into Bubble Territory; Dow Hits Record High After Services Index Rise; Europe Rallies

Ulli Market Commentary Contact

Tue pic

[Chart courtesy of MarketWatch.com]

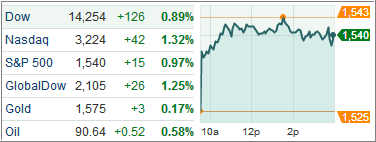
The Dow Jones Industrial Average jumped to a new high Tuesday, trimming losses from the financial crisis after a four-year rally, fueled by monetary stimulus from the Federal Reserve and alleged indications of an improving economy.

Equities extended their gains after the Institute for Supply Management’s index for non-manufacturing activity rose to 56 percent from 55.2 percent in Jan., marking its 39th consecutive month of expansion.

The Dow industrials (DJIA) jumped 126 points to 14,253.77, easily topping the its all-time closing high of 14,164.53 set on Oct 9, 2007, ahead of the global financial meltdown.

The 30-component blue-chip index fell 34 percent in 2008 after the housing bubble burst and the federal government had to move in to save the US banking system.

A $2.3 trillion in Fed stimulus pushed investors back in equities, sending the Dow up more than 116 percent from the March 2009 low of 6,547.05. The index’s valuation remains 19 percent less than the price-earnings ratio at the previous peak and 14 percent below its 20-year average.

You hear most analysts pounding their chest about how much better off we are now than we were the last time the Dow was here. Are we really? Take a look at this list:

Read More