ETF/No Load Fund Tracker Newsletter For Friday, April 12, 2013

Ulli ETF Tracker Contact

ETF/No Load Fund Tracker StatSheet

————————————————————-

THE LINK TO OUR CURRENT ETF/MUTUAL FUND STATSHEET IS:

https://theetfbully.com/2013/04/weekly-statsheet-for-the-etfno-load-fund-tracker-newsletter-updated-through-04112013/

————————————————————

Market Commentary

Friday, April 12, 2013

NEGATIVE EARNINGS AND ECONOMIC DATA DISRUPT WALL STREET RUN

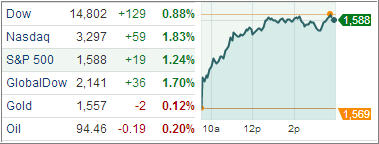
The four day winning streak ended today as stocks succumbed across major averages. The S&P 500 led the way, falling 0.3%; the Nasdaq lost 0.2% and the Dow Jones industrial average closed fractionally lower.

Disappointing consumer data led the way. Retail sales in the U.S. dropped in March by the most in nine months. According to Commerce Department, purchases fell 0.4 percent, the biggest setback since June, after jumping 1 percent in February. The number is pointing to a slowdown in consumer spending as the first quarter drew to a close. Economists were prompted to trim consumer spending forecasts from what could be the best quarter in two years. Gains in hiring and wages will be needed to ensure any slowdown proves temporary as federal budget cuts and an increase in the payroll tax restrain the expansion.

Financial stocks were pressured on Friday by a pair of disappointing bank results and a delay in closing a large bank deal. All eyes were on JPMorgan (JPM) and Wells Fargo (WFC) today after both reported earnings ahead of the opening bell. Wells Fargo’s revenue came up short by $300 million at $21.3 billion. Shares of Wells dropped 0.8 percent while JPMorgan was off 0.6 percent.
Read More

Weekly StatSheet For The ETF/No Load Fund Tracker Newsletter – Updated Through 04/11/2013

Ulli ETF StatSheet Contact

ETF/Mutual Fund Data updated through Thursday, April 11, 2013

Table of Content082312

If you are not familiar with some of the terminology used, please see the Glossary of Terms.


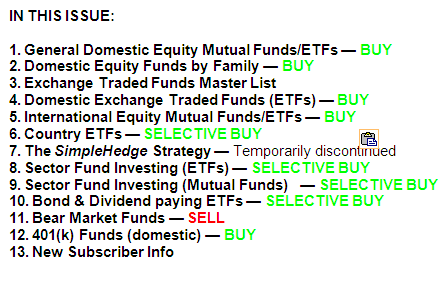
1. DOMESTIC EQUITY MUTUAL FUNDS/ETFs: BUY — since 10/25/2011

TTI

The domestic TTI broke through its long-term trend line generating a Sell for this area effective 8/9/2011. Over the recent past, we’ve seen the TTI hovering slightly below and above this dividing line between bullish and bearish territory. The clear break to the upside occurred on 10/24/11 and, effective 10/25/11, a new Buy signal for domestic equities went into effect.

As of today, our Trend Tracking Index (TTI—green line in above chart) has bounced off its long term trend line (red) by +4.22% as part of the post election rebound.

To avoid a potential whip-saw, a Sell signal to move out of all domestic equity positions will be generated once we have clearly pierced the line to the downside. Be sure to tune into my blog for the latest updates.

Read More

Retailers And Jobless Claims Helped Push Major Market ETFs To Higher Ground

Ulli Market Commentary Contact

Thur pic

[Chart courtesy of MarketWatch.com]

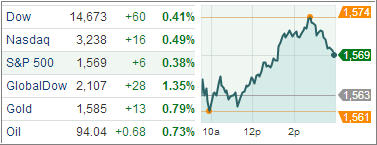
The market continued its rally to a fourth day after struggling for direction earlier in the session. Two of the three major stock indexes pushed further into record high ground. The Dow Jones industrial average and the S&P 500 rose 0.4% each. They were up as much as 0.6% apiece. The Nasdaq was only fractionally higher.

The market opened with an early boost from a larger-than-expected drop in weekly jobless claims. According to Labor Department, jobless claims dipped by 42,000 (or 11%) to 346,000 in the week ended April 6, from a revised 388,000. The median forecast of 49 economists surveyed by Bloomberg called for a drop to 360,000. Based on these numbers, a slowdown in hiring last month may have been temporary, easing concern the labor market was taking a turn for the worse. A surprising turn in better sales from retailers also gave investors more encouragement.

19 out of 24 industries in the S&P 500 gained. Retailers jumped the second most, rallying 1.4 percent. On the opposite side, The S&P Information Technology Index dropped 0.8 percent, after the biggest jumped since January yesterday. Personal- computer shipments plummeted in every region of the world in the first quarter as buyers opted for smartphones and tablet and Microsoft’s Windows 8 met with weak demand. Global PC unit shipments fell 14 percent. Makers of computer hardware and software fell sharply. Hewlett-Packard dropped 6 percent, Microsoft fell 5 percent and Intel 2 percent.

Read More

Another Wild Run On The Street As The Bull Hits New Records

Ulli Market Commentary Contact

Wed pic

[Chart courtesy of MarketWatch.com]

Stocks were off to the races Wednesday, as the S&P 500 marched to its highest level ever. Markets climbed 1 percent on Wednesday, with both the Dow and S&P 500 ending at historic highs as cyclical shares led the way higher for a second straight day.

The S&P 500 finally surged past the record set in Oct 2007, joining the new all-time intraday high club. The index has struggled to breach the level of 1,576.09 for the past several weeks, but surpassed above it on Wednesday to rally as high as 1,589.07. The Dow also hit another intraday milestone, rising as high as 14,826.66.

All 10 industries in the S&P 500 advanced. Buying was focused in the tech and health-care sectors as they surged 1.8 percent. The S&P 500 and Dow rose 1.2 percent and 0.9 percent, respectively. In another encouraging sign, data showed NYSE and Nasdaq volume in the stock market today was higher than Tuesday’s levels. However, it remained below the daily average so far this year of about 6.36 billion shares.

Read More

7 ETF Model Portfolios You Can Use – Updated through 4/9/2013

Ulli Model ETF Portfolios Contact

In regards to the S&P 500, it was a slow week with the index mainly hovering below its unchanged line but in the end it gave back only 1 point since the last ETF Model Portfolio report.

There has definitely been a slowdown in upward momentum in regards to equity indexes but our model portfolios all gained as the market pullback supported some of the bond positions. YTD it’s been equities that have taken the limelight and gold turned out to be the loser, at least to this moment in time.

Right now, the focus is on the upcoming earnings season, and it would not surprise me to see the indexes head further north based on the motto of this year that bad news is good news and good news is good news, which is one of those results you get when you live in a centrally planned market environment.

Sure, it makes me wonder how long this can go on, but as trend followers we don’t concern ourselves with the answer, since no one has it anyway, but we’ll simply continue to track the trends and let our sell stops provide the answer as to when it’s time to get out.

In the meantime, here is the latest update for our Model ETF Portfolios, which you can use based on your risk tolerance:

Read More

Market Heads North Close To Record High While Economy Continues South

Ulli Market Commentary Contact

Tue pic

[Chart courtesy of MarketWatch.com]

Stocks surged on Tuesday, with the Dow closing at a record high on a rally in cyclical shares and as earnings season started to heat up. The S&P 500 hit an intraday high of 1,573.89, just below its October 2007 intraday high of 1,576; which is a nice recovery from the losses last week.

Investors are eying the start of earnings season and firm economic readings from overseas. Energy and materials were top performers, drawing support from Chinese inflation that slowed more than expected. Gold settled at its highest level in more than a week; crude oil rose on global supply concerns.

There is clear sign that investors are using market declines as buying opportunities, as the markets return to near-record levels. Stocks got a boost from a promising start to the earnings season. According to Thomson Reuters, about 5 percent of S&P 500 companies have reported results so far, almost three-quarters of them have topped expectations.

Read More