 The ETF/No Load Fund Tracker—Monthly Review—February 28, 2013
US Equities Advance In February; Europe Rises For The Ninth Straight Month
Major US equity averages added more than one percent in February with the Dow Jones Industrial Average and S&P 500 coming close to their all time highs as markets turned choppy toward the end of the month on mixed economic data and political deadlock on the so-called sequester or federal spending cuts of up to $85 billion over the next six months.
Central banks across the Atlantic provided the required market stability with Fed Chairman Bernanke reiterating the continuation of the central bank’s ultra-loose monetary policy in his two-day Congressional testimony while the European Central Bank President Mario Draghi said the bank was far from exiting its expansionary monetary policy stance.
The positive trading mood came after the US Commerce Department said the economy expanded at a 0.1 percent annual rate in the fourth quarter, better than an initial reading of minus 0.1 percent, but well below the third quarter’s 3.1 percent clip.
Also, first-time jobless claims dropped by 22,000 to 344,000 in the week ended Feb. 23, suggesting private-sector hiring remains decent even as the businesses get ready for large federal spending cuts to kick in through sequestration.
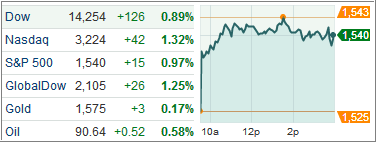
The Dow Industrials added 1.4 percent for the month while the S&P 500 index rose 1.1 percent from the end of January. The tech-laden NASDAQ Composite index picked up 0.6 percent for February.
The housing sector continued to be on the mend with contracts to buy previously owned homes rising 4.5 percent in Jan. Also new-home sales jumped 15.6 percent in Jan to an annual pace of 437,000, the highest rate since July 2008. Also, the Federal Housing Finance Agency said home prices rose 0.6 percent in December.
On the flip-side, construction spending took a hit in Jan. as spending tumbled 2.1 percent after rising 1.1 percent in Dec. Public spending shrank by 1 percent while private spending contracted by 2.6 percent.
Personal income fell by 3.6 percent in Jan. after rising 2.6 percent in Dec. Expiration of payroll tax cut and lack of dividend payouts were expected to bring down income levels in Jan. But, alarmingly, employee compensation also dropped 0.4 percent for the month, which means the consumer can’t really be counted on to pull the economy out of the doldrums.
Our main tracking indicator, the Domestic Trend Tracking Index (TTI) continued its march higher and ended the month +3.12% above its long-term trend line as the chart shows:
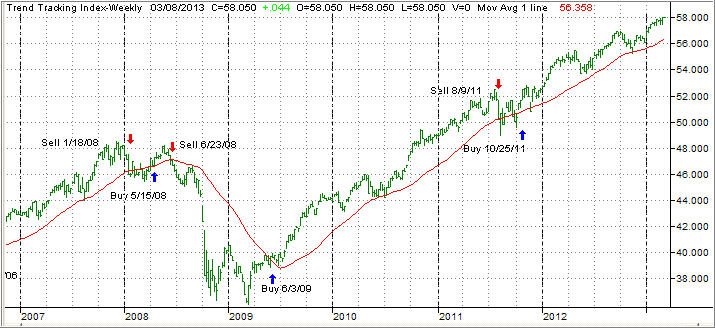
With the Fed continuing to flood the markets with some $85 billion every month, it’s no surprise that some of that money finds itself moving into the stock market pushing the indexes to levels that are out of line with fundamentals. I have pounded on that theme for a long time; nevertheless, the trend remains up.
I am readjusting some of our positions to be in better tune with that reality without undue risk. For example, some of our holdings in consumer staples (XLP) have done extremely well, especially during market pullbacks. I am looking to increase exposure as this area appears to be one that complements our trend tracking approach very well. We originated some of our XLP position in 2011 and never came close to being stopped out even during times of extremely volatile market behavior.
Looking at the big picture, there is no question in my mind that index levels have reached bubble territory, which means we have to be alert to the fact that a trend reversal can strike at anytime. All of our sell stops have been identified and will be executed once market activity indicates that it is best to do so.