ETF/No Load Fund Tracker Newsletter For Friday, March 8, 2013
ETF/No Load Fund Tracker StatSheet
————————————————————-
THE LINK TO OUR CURRENT ETF/MUTUAL FUND STATSHEET IS:
https://theetfbully.com/2013/03/weekly-statsheet-for-the-etfno-load-fund-tracker-newsletter-updated-through-03072013/
————————————————————
Market Commentary
Friday, March 8, 2013
MARKET INDEXES GAIN MORE THAN 2 PERCENT FOR THE WEEK; EUROPE RISES ON US JOBS DATA
US indexes notched weekly gains of more than 2 percent as the Dow Industrials and the S&P 500 closed higher for the sixth straight trading session, after data showed employers added more jobs than forecast last month and unemployment rate fell to a four-year low.
Friday’s job report capped off a string of positive labor reports that gave investors reason to believe that the economy is finally on a firmer footing and may weather a combination of payroll tax hikes and federal spending cuts.
Labor Department report in Washington showed employment rose 236,000 last month after a downwardly revised 119,000 gain in January. Economists had forecast a job gain of about 165,000. Jobless rate fell to 7.7 percent in Feb. from 7.9 percent the month before as hiring in construction jumped the most in nearly six years.
Separately, a Commerce Department report showed inventories at the wholesale level rebounded sharply in January, rising 1.2 percent in the biggest jump since Dec 2011.
Global stocks rallied earlier after the Japanese Cabinet Office said gross domestic product expanded at an annualized 0.2 percent in the fourth quarter, bettering a preliminary estimate that showed the world’s third largest economy contracted 0.4 percent during the period.
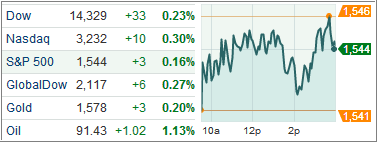
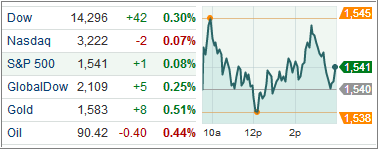
The Dow Jones Industrial Average (DJIA) added 68 points for the day to finish at 14,397, capping its weekly gain at 2.2 percent. The S&P 500 Index (SPX) rose 7 points to 1,551 with consumer discretionary fronting the gains. All the 10 business groups within the benchmark index finished higher for the day. The S&P 500 is up 2.2 percent for the week and only 14 points from its all-time record, which, with continued money pumping, should be taken out very shortly.
Treasury prices dropped, pushing 10-year yields to an 11-month high after reports showed US employers added more jobs than forecast and jobless rate fell, indicating the Fed’s accommodative monetary policies are starting to stimulate the real economy.
The US dollar advanced against majority of its most-traded rivals Friday after February nonfarm payrolls beat expectations and jobless rate fell unexpectedly.
Meanwhile, European stocks rallied on strong US nonfarm payrolls data Friday, notching their biggest weekly gain in two months.
The pan-European Stoxx Europe 600 index rose 0.8 percent to end at 295.55, extending gains into a third week and marking the highest level since June 2008. The benchmark has added 2.3 percent for the week and gained 5.7 percent so far this year.
Enthusiasm was tempered early after Fitch Ratings agency downgraded Italy by one notch citing political instability after the recently held inconclusive elections. But investors soon found inspiration from Asia after data released by Chinese customs administration showed exports increased 21.8 percent in Feb. from a year earlier, beating estimates of an 8.1 percent decline.
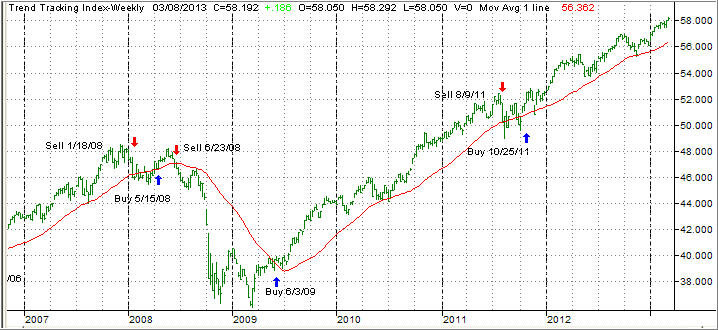
Our Trend Tracking Indexes (TTIs) moved higher with the major indexes and deeper into bullish territory. For the week, here’s how we ended up:
Domestic TTI: +3.29% (last week +3.10%)
International TTI: +10.24% (last week +8.56%)
Have a great week.
Ulli…
————————————————————-
READER Q & A FOR THE WEEK
All Reader Q & A’s are listed at our web site!
Check it out at:
http://www.successful-investment.com/q&a.php
A note from reader Steve:
Q: Ulli: Can you provide a basic explanation of your momentum (M-Index) without giving away your proprietary method?
A: Steve: All terms are described in the Glossary section, which is posted on the top of every StatSheet. In case you missed it, you can read it here:
http://www.successful-investment.com/GlossaryOfTerms.pdf
———————————————————-
WOULD YOU LIKE TO HAVE YOUR INVESTMENTS PROFESSIONALLY MANAGED?
Do you have the time to follow our investment plans yourself? If you are a busy professional who would like to have his portfolio managed using our methodology, please contact me directly or get more details at:
https://theetfbully.com/personal-investment-management/
———————————————————
Back issues of the ETF/No Load Fund Tracker are available on the web at:
https://theetfbully.com/newsletter-archives/

 First Trust Advisors, the Illinois-based provider of exchange traded funds (ETFs), has unveiled the First Trust High Yield Long/Short ETF (HYLS), an actively managed high-yield bond ETF designed to provide investors with capital appreciation and current income.