7 ETF Model Portfolios You Can Use – Updated through 3/26/2013

Ulli Model ETF Portfolios Contact

The events in Cyprus were front and center over the past week as the story lines changed more often than I care to count. In the end, the parliamentary process was circumvented as the European overlords dictated the terms without paying any attention to minor details such as a democratic process.

That’s been pretty much the theme throughout the European debt crisis as non-elected government officials make the rules without wanting to engage the voting public. Nevertheless, the S&P 500 recuperated from the prior small pullback and advanced 1% since last week’s ETF Model Portfolio report.

The benchmark has now reached a level that is again within striking distance of its 2007 all-time high, and I expect that number to be taken out shortly.

If you feel like you are left out and can’t decide how to participate conservatively in this bullish run, feel free to give to email me or give me a call. Especially, if you have a 401k with one of the large providers such as Fidelity or Vanguard, there are low volatility mutual funds in existence you are probably not aware of that are very suitable with trend tracking.

In the meantime, here is the latest update for our Model ETF Portfolios, which you can use based on your risk tolerance:

Read More

US Indexes Surge On Manufacturing, Housing Improvement; Europe Rises On US Data

Ulli Market Commentary Contact

Tue pic

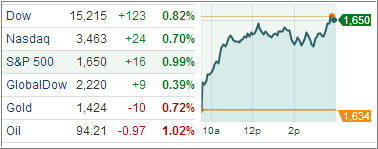
[Chart courtesy of MarketWatch.com]

Index ETFs advanced Tuesday, with the S&P 500 Index rebounding to within two points of its record and the Dow Industrials hitting a new high, after US durable goods orders rose more than estimated in February and home prices jumped the most since June 2006.

The Commerce Department reported orders for durable goods rose 5.7 percent in February, mainly due to a surge in automobile and aircraft orders. The number exceeds expectations of a growth rate of about 5 percent and suggests the economy is expanding at a 2.5-3 percent annual rate.

Equities got a boost today as residential real estate prices rose by 8.1 percent in January from a year ago, marking the biggest year-over-year growth since June 2008, according to the S&P Case-Shiller index released today.

On a downbeat note, consumer confidence slumped to 59.7 in March from a revised three-month high of 68 in the prior month as Washington’s budget battle soured Americans’ outlook of the economy.

Read More

Travelling…

Ulli Uncategorized Contact

I will be spending most of the day on an air plane and in taxis getting back to my office. I most likely won’t have a chance to write today’s market commentary but will resume posting on Tuesday.

Ulli…

ETFs/Mutual Funds On The Cutline – Updated Through 3/22/2013

Ulli ETFs on the Cutline Contact

Below are the latest ETF Cutline reports, which show how far above or below their respective long-term trend lines (39 week SMA) my currently tracked ETFs/MFs are positioned.

The first report covers the ETF Master List from Thursday’s StatSheet and includes 398 ETFs, of which currently 343 (last week 353) of them are hovering in bullish territory.

The second report includes only High Volume ETFs. To clarify, High Volume (HV) ETFs are defined as those with an average daily volume of $10 million or higher.

These ETFs are generated from my selected list of some 93 that I use in my advisor practice. It cuts out the “noise,” which simply means it eliminates those ETFs that I would never buy because of their volume limitations. 70 ETFs (last week 79) have managed to remain in bullish territory after the recent market volatility.

The third report covers Mutual Funds on the Cutline. There are currently 812 (last week 815) above the line and 47 below it out of the 859 that I follow.

Take a look:

1. ETF Master Cutline Report

2. ETF High Volume Cutline Report

3. MF Cutline Report

In case you are not familiar with some of the terminology used in the reports, please read the Glossary of Terms.

Last Week In Review: ETF News And Blog Posts To 3/24/2013

Ulli Market Review Contact

In case you missed it, here’s a summary of the ETF topics and market reviews I posted to my blog during the week ending on 3/24/2013.

The events in Cyprus slowed the march of the major indexes towards infinity for just a bit with the S&P 500, after much meandering, only giving back some 4 points for the week.

Nevertheless, the major trend, as identified by our Trend Tracking Indexes (TTIs) remains clearly bullish in equities and, despite widely varying market opinions, we will continue to hold our positions until either the long-term trend lines get broken or our trailing sell stops initiate the signal to exit and step aside.

Most bond ETFs have been slipping and sliding with some breaking their respective trend lines to the downside, which means a reversal has occurred causing us to exit those holdings.

Over past week, we covered the following:

Read More

One Man’s Opinion: Will The Fed Continue To Buy $85 Billion A Month In Assets Through 2013?

Ulli Market Commentary Contact

92835431The US Federal Reserve will continue with its $85 billion-a-month assets purchase-program at least till the third quarter of 2013, feels Neil Datta, the Head of US Economics at Renaissance Macro Research.

Given the Fed’s propensity to air on the side of caution, the likelihood is that they keep buying into early 2014, he noted. The Fed made it clear at the end of its two-day FOMC meeting that they are going to taper the pace of assets purchase should the economic conditions improve even before unemployment rate hits 6 ½ percent; so it’s a little clarity in terms of their thresholds, Neil added.

Asked when the threshold will be reached where markets will make the first move, before the Fed makes any formal announcement for policy change, Neil said six consecutive months of 200,000 job additions from now will probably force the Fed to slow down its assets purchase program. That’s the benchmark Chicago Fed President Charlie Evans has set the target for, he noted. It was surprising to see the Fed saying every economic indicator is skewed to the downside.

Read More