In case you missed it, here’s a summary of the ETF topics and market reviews I posted to my blog during the week ending on 3/31/2013.
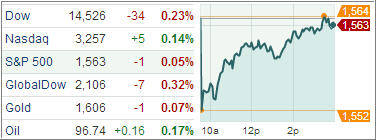
Despite the uncertainty and questionable outcome of the Cyprus debacle, the US markets only took a short breather before continuing their relentless match towards higher milestones. The S&P 500 finally hit pay dirt on Thursday by taking out its 2007 all-time high.
What that means is that if you were unfortunate enough to have bought the index on that day in 2007, you have now, 6 years later, finally broken even. Congratulations!
With the Fed continuing the monetization of our debt at the rate of $85 billion a month, with no indication of slowing down, some of that money finds a new home in the stock market acting as the driver to push these indexes towards “out of touch with reality” levels.
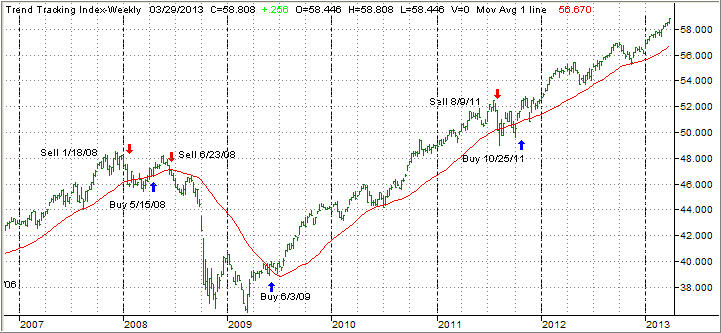
Eventually, this market orgy will end, but the timing of it is still unknown. In the meantime, we will continue holding our positions in low volatility ETFs subject to our trailing sell stop discipline, which will take us out of the market when a trend reversal finally makes an appearance.
As an aside, in terms of ETFs, low volatility does not equate with sub-par performance. There are several that have outperformed the indexes YTD by a considerable margin.
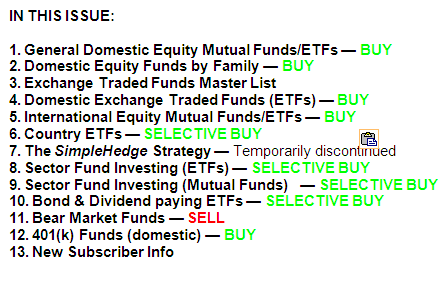
Over past week, we covered the following: