One Man’s Opinion: Are The US Jobs Data Discouraging?

Ulli Market Commentary Contact

92835431The latest nonfarm payroll report shows the US economy created 88,000 jobs in March following a revised 268,000 gain in February though the jobless rate slumped to a four-year low of 7.6 percent due to a decline in the size of the labor force and participation rate.

The labor force participation rate and the number of people leaving the workforce have been disappointing and nobody expected the latest round of readings in the middle of a recovery, says Sharon Stark, Fixed Income Strategist at DA Davidson.

Asked if the bond rally will hold in the future after today’s jobs number, Sharon said investors can use this opportunity to shed some of their non-performing assets, especially those which may deteriorate in value when interest rates start to climb. There may be some backtracking from where yields were and markets are likely to see some consolidation around 1.75-1.80 percent for 10-year Treasury notes, though this opportunity should be used for cleaning up fixed-income portfolios, she added.

Read More

New ETFs On The Block: Advisorshares Newfleet Multi-Sector Income ETF (MINC)

Ulli Fixed Income ETFs Contact

71080438AdvisorShares, the Bethesda, Maryland-based sponsor of actively managed exchange-traded funds, has teamed up with San Francisco-based Newfleet Asset management, to launch a global broad-based income focused fund, the AdvisorShares Newfleet Multi-Sector Income ETF (MINC). If you are looking for exposure to all major bond sectors through a value-oriented approach, you may find MINC attractive.

MINC aims to provide current income consistent with preservation of capital, while limiting variations in net asset value due to changes in interest rates. To achieve its investment objective, the sub-advisor employs active sector rotation and disciplined risk-management in the construction of the fund’s portfolio.

Since MINC is an actively managed ETF, it does not seek to replicate the performance of a specified passive index of securities; rather the fund uses a top-down, relative value approach that assesses factors such as yield and spread, supply and demand, investment environment and sector fundamentals.

Read More

04-05-2013

Ulli Newsletter Archives Contact

ETF/No Load Fund Tracker Newsletter For Friday, April 5, 2013

ETF/No Load Fund Tracker StatSheet

————————————————————-

THE LINK TO OUR CURRENT ETF/MUTUAL FUND STATSHEET IS:

https://theetfbully.com/2013/04/weekly-statsheet-for-the-etfno-load-fund-tracker-newsletter-updated-through-04042013/

————————————————————

Market Commentary

Friday, April 5, 2013

SUBPAR JOBS REPORT PUNISHES US INDEXES; EUROPEAN STOCKS TRACK LOWER

US index ETFs slumped Friday, capping the biggest weekly decline for the S&P 500 Index, after a government report showed less than half of estimated Americans found jobs in March. Though the wheels didn’t fall of the economy as one month doesn’t make a trend, expectations were certainly tempered as investors became concerned about the pace of the economy’s recovery.

Payrolls rose by 88,000 in March, the smallest in nine months, following an upwardly revised gain of 268,000 in February. Economists had projected an advance of 190,000.

The unemployment rate dropped to a four-year low of 7.6 percent from 7.7 percent in the previous month. However, that was hardly any consolation as 500,000 discouraged workers dropped out of the labor force. The labor force participation rate, a gauge that tracks the number of people employed or looking for jobs, slipped to 63.3 percent, the lowest since May 1979.

After sinking 171 points, the Dow Jones Industrial Average (DJIA) reclaimed most of its losses to end at 14,565, down 0.3 percent on the day and 0.1 percent for the week.

The day’s sell-off was broad-based with 18 of the blue-chip index’s 30 components ending in the red.

The S&P 500 Index (SPX) shed 7 points to 1,553 with technology companies fronting the losses and utilities faring the best among its 10 business groups. The benchmark index is down 1 percent for the week, its biggest decline since December.

Treasury prices surged, pushing 10-year note yields to the lowest level in almost four months after the sorely disappointing jobs report spurred speculation the world’s largest economy is slowing.

The US dollar eased up against most of its major trading peers Friday as the surprisingly weak jobs report raised hopes the Federal Reserve will not taper its assets purchase program anytime soon.

European stock markets posted their biggest weekly decline since late October as US March employment data fell well short of expectations, while the European Central Bank said downside risks remain to the region’s recovery.

The Stoxx Europe 600 index tripped 1.6 percent, the lowest in more than one month. With this week’s decline, the benchmark index completed its longest string of losses in 10 months and pared the gauge’s advance so far this year to 2.7 percent.

The DAX 30 index fell 2 percent in Frankfurt, sending it lower by 1.8 percent for the week.

The CAC 40 index slipped 1.7 percent in Paris, capping the weekly loss at 1.8 percent while the FTSE 100 index trimmed 1.5 percent in London.

Our Trend Tracking Indexes (TTIs) headed south as well, but remain on the bullish side of their respective trend lines.

Again, as I have repeatedly posted, the international TTI has been slipping sharply and, as is no surprise, I do not recommend any holdings in Europe given their political disarray and worsening economic data points.

For the week, the TTIs ended as follows:

Domestic TTI: +3.16% (last week +3.96%)

International TTI: +5.93% (last week +8.13%)

Again, we will hold all equity ETF positions until our exit strategy signals otherwise.

Have a great week.

Ulli…

————————————————————-

READER Q & A FOR THE WEEK

All Reader Q & A’s are listed at our web site!
Check it out at:

http://www.successful-investment.com/q&a.php

A note from reader Doug:

Q: Ulli: I read in your material that you have exited some bond ETF positions because of sell signals in that area. Did that activity supersede the 7% stop that you had on those bond positions? In other words, did something other than the 7% decline in share price cause you to exit the positions? If so, what was it?

A: Doug: For bond ETFs, I use a 5% trailing stop loss, but overriding was the fact that some of our holdings BND, TIP, TLH had not only broken below their long term trend lines but were showing poor performance. While some did recover, I found better opportunities elsewhere, like in low volatility equity ETFs.

Again, in regards to stop losses, for broadly diversified domestic/international funds/ETFs, I use 7%, for bonds, I use 5% and for sector and country ETFs, I use 10%.

———————————————————-

WOULD YOU LIKE TO HAVE YOUR INVESTMENTS PROFESSIONALLY MANAGED?

Do you have the time to follow our investment plans yourself? If you are a busy professional who would like to have his portfolio managed using our methodology, please contact me directly or get more details at:

https://theetfbully.com/personal-investment-management/

———————————————————

Back issues of the ETF/No Load Fund Tracker are available on the web at:
https://theetfbully.com/newsletter-archives/

ETF/No Load Fund Tracker Newsletter For Friday, April 5, 2013

Ulli ETF Tracker Contact

ETF/No Load Fund Tracker StatSheet

————————————————————-

THE LINK TO OUR CURRENT ETF/MUTUAL FUND STATSHEET IS:

https://theetfbully.com/2013/04/weekly-statsheet-for-the-etfno-load-fund-tracker-newsletter-updated-through-04042013/

————————————————————

Market Commentary

Friday, April 5, 2013

SUBPAR JOBS REPORT PUNISHES US INDEXES; EUROPEAN STOCKS TRACK LOWER

US index ETFs slumped Friday, capping the biggest weekly decline for the S&P 500 Index, after a government report showed less than half of estimated Americans found jobs in March. Though the wheels didn’t fall of the economy as one month doesn’t make a trend, expectations were certainly tempered as investors became concerned about the pace of the economy’s recovery.

Payrolls rose by 88,000 in March, the smallest in nine months, following an upwardly revised gain of 268,000 in February. Economists had projected an advance of 190,000.

The unemployment rate dropped to a four-year low of 7.6 percent from 7.7 percent in the previous month. However, that was hardly any consolation as 500,000 discouraged workers dropped out of the labor force. The labor force participation rate, a gauge that tracks the number of people employed or looking for jobs, slipped to 63.3 percent, the lowest since May 1979.

Read More

04-05-2013

Ulli Newsletter Archives Contact

Buy-Sell Cycles

The ETF/No Load Fund Tracker Monthly Review—March 31, 2013

S&P 500 Finishes At A Record High And Erases Losses From 2008; Europe Higher For A 10th Month

US equities finished March on a high, lifted by relief that Cyprus averted an economic collapse and surprisingly strong domestic economic data. On the last trading day of the month, the S&P 500 surpassed its record high closing set in October 2007, thus erasing all of its losses from the 2008 financial crisis. The Dow Industrials exceeded its 2007 all-time high on March 5.

The month’s economic data largely beat forecasts, providing more evidence the US economic recovery is allegedly gaining momentum. Revised Commerce Department figures showed gross domestic product expanded by 0.4 percent in the final quarter of 2012, better than a 0.1 percent previous estimate.

Construction spending rose by 1.2 percent in February, beating the 1 percent rise predicted by economists. Home prices in January jumped the most since 2006. Also consumer confidence surged unexpectedly in March while consumer spending in February climbed the most in five months.

On a downbeat note, the Institute for Supply Management’s factory index slipped to 51.3 in March from 54.2 percent in February. A separate survey by Markit showed US manufacturing slowed slightly in March, with its reading coming in at 54.6, lower than the 55 level analysts had expected.

However, factory orders rose by 3 percent in February, driven mainly by higher orders for aircraft, a Commerce Department report revealed. Excluding transportation, orders rose a measly 0.3 percent. Orders for US-made durable goods, products expected to last at least three years, jumped 5.6 percent in February. Factory orders for January were revised upwards to show a 1 percent decline instead of the 2 percent as originally reported.

European stocks marked their 10th straight month of gains in March, with the pan-European Stoxx Europe 600 index adding 1.3 percent for the month. Economic turmoil in Cyprus hogged headlines for the better part of the month while continued political stalemate in Italy brought the country back in the limelight.

Corporate earnings-growth is likely to limit the impact of tighter fiscal policies in the US. With more data showing the US economy getting stronger, don’t be surprised if the Fed slows down the pace of its monthly bond purchases in the second half of 2013, unless Europe springs unpleasant surprises.

Of course, once the Fed slows down its money printing efforts from the current $85 billion per month, there is no way of knowing if the market indexes can continue their torrid pace; but I doubt it.

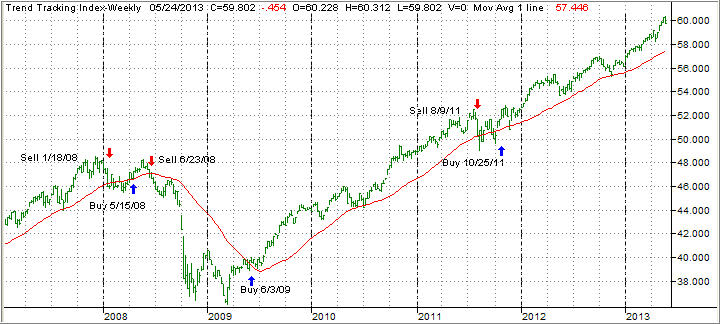
Our Domestic Trend Tracking Index (green line) headed north following the direction of equities and ended the month solidly on the bullish side of the trend line (red line) as the chart shows:

TTI

With all that bullishness, thanks to the Fed’s injection of newly created money, it came as no surprise that bonds floundered and some of them even broke their trend lines to the downside. As a result, I liquidated BND and TIP.

The place to be invested in given the assist the Fed has been throwing is equity ETFs. My preference has been, as I posted frequently, to seek exposure in low volatility products. Again, do not confuse low volatility with low performance as the ones we are invested in have all outperformed the S&P 500 YTD.

Some of my favorites are consumer staples (XLP) followed by the low volatility S&P 500 index (SPLV) both of which helped recent portfolio performance. Once the market turns south again, I would expect these ETFs to lag the overall market keeping us exposed a little longer and therefore avoiding a whipsaw signal in the event a pullback is only short-lived.

If a market top is reached, which will happen at some time, our trailing sell stops are in place to pull us out before serious damage occurs. With the markets being as manipulated as they are and Europe pretty much stuck in a severe economic slowdown, a sudden unexpected event could bring the equity indexes more in line with real underlying fundamentals, which is simply a nice way of saying that a sudden and violent correction  could be one of those unintended consequences of central market planning.

That’s why I keep harping on the fact that a disciplined exit strategy is an absolute “must have” in order to deal with the uncertainties of our times.


Weekly StatSheet For The ETF/No Load Fund Tracker Newsletter – Updated Through 04/04/2013

Ulli ETF StatSheet Contact

ETF/Mutual Fund Data updated through Thursday, April 4, 2013

Table of Content082312

If you are not familiar with some of the terminology used, please see the Glossary of Terms.


1. DOMESTIC EQUITY MUTUAL FUNDS/ETFs: BUY — since 10/25/2011

TTI

The domestic TTI broke through its long-term trend line generating a Sell for this area effective 8/9/2011. Over the recent past, we’ve seen the TTI hovering slightly below and above this dividing line between bullish and bearish territory. The clear break to the upside occurred on 10/24/11 and, effective 10/25/11, a new Buy signal for domestic equities went into effect.

As of today, our Trend Tracking Index (TTI—green line in above chart) has bounced off its long term trend line (red) by +3.32% as part of the post election rebound.

To avoid a potential whip-saw, a Sell signal to move out of all domestic equity positions will be generated once we have clearly pierced the line to the downside. Be sure to tune into my blog for the latest updates.

Read More