Stocks were off to the races Wednesday, as the S&P 500 marched to its highest level ever. Markets climbed 1 percent on Wednesday, with both the Dow and S&P 500 ending at historic highs as cyclical shares led the way higher for a second straight day.
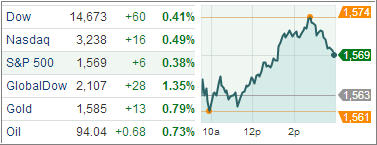
The S&P 500 finally surged past the record set in Oct 2007, joining the new all-time intraday high club. The index has struggled to breach the level of 1,576.09 for the past several weeks, but surpassed above it on Wednesday to rally as high as 1,589.07. The Dow also hit another intraday milestone, rising as high as 14,826.66.
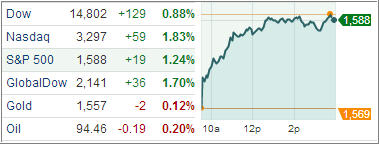
All 10 industries in the S&P 500 advanced. Buying was focused in the tech and health-care sectors as they surged 1.8 percent. The S&P 500 and Dow rose 1.2 percent and 0.9 percent, respectively. In another encouraging sign, data showed NYSE and Nasdaq volume in the stock market today was higher than Tuesday’s levels. However, it remained below the daily average so far this year of about 6.36 billion shares.