ETF/No Load Fund Tracker Newsletter For Friday, June 21, 2013
ETF/No Load Fund Tracker StatSheet
————————————————————-
THE LINK TO OUR CURRENT ETF/MUTUAL FUND STATSHEET IS:
https://theetfbully.com/2013/06/weekly-statsheet-for-the-etfno-load-fund-tracker-newsletter-updated-through-06202013/
————————————————————
Market Commentary
Friday, June 21, 2013
BIG WEEKLY LOSSES DESPITE LATE GAINS
U.S. equities escaped from ending in the red on the heels of the worst two-day decline in over a year and closed mostly higher on Friday. Blue chip stocks were able to regain some of their strength to finish with nice gains amid the continued hangover from statements from Fed Chief Ben Bernanke.
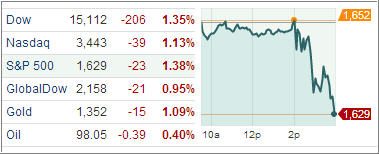
The Dow Jones Industrial Average rose 41 points (0.3%) to 14,799, the Standard & Poor’s 500 Index gained 4 points (0.3%) to 1,592, while the Nasdaq Composite shed 7 points (0.2%) to 3,357 with pressures coming from the weakness in large technology shares. In heavy volume on a quadruple-witching day, 1.9 billion shares were traded on the NYSE, and 2.8 billion shares changed hands on the Nasdaq.
Technology stocks lagged from the opening bell when Oracle’s shares fell 9.3% in reaction to a disappointing earnings report. Other major tech components like Apple and Google also settled in the red. Rising Treasury yields have been in focus all week with the climb continuing today.
The benchmark 10-yr yield jumped almost ten basis points to 2.514%, its highest level since August 2011. Despite the ongoing rise in yields, income-oriented sectors held up well today as telecom services and utilities ended with respective gains of 0.6% and 1.3%. However, the two defensive sectors ended the week with respective losses of 3.7% and 2.8%. Also of note, the financial sector ended in line with the broader market, but major banks came under pressure after a Bloomberg story suggested U.S. regulators are thinking the idea of doubling minimum capital requirements for the country’s largest banks.
On economic news, existing home sales rose 4.2% in May, the most in nine months, to a 5.18 million unit annual rate, above the consensus for a 0.6% gain to 5.0 million units. Real median prices advanced at a record 11.2% from a year ago, and could continue to provide impetus to economic growth over the next six months.
The week started with two consecutive days of gains. However, those quickly evaporated after Federal Reserve Chairman Ben Bernanke confirmed what many had feared in his press conference, saying that Fed could reduce the pace of purchases later this year with a potential end to purchases coming in the middle of 2014.
Following the news, equities across the globe tumbled before gaining some back today heading into the weekend. For the week, the Dow fell 1.8%, the S&P was down 2.1%, and the Nasdaq lost 1.9%. It was the biggest weekly decline for all three since April and also the fourth week of losses out of the past five.
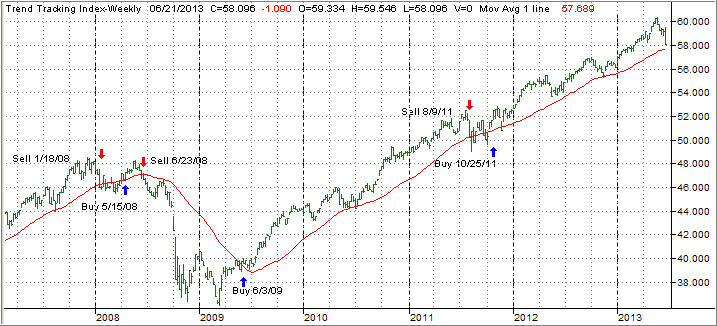
It’s interesting to note that all of this weakness comes on 5th anniversary of our last major sell signal of 6/23/08. Here we are within striking distance of leaving the equity markets again, a trend, which started today, as we liquidated those holdings that had triggered their respective sell stops.
It will not take much more of a sell off before we will head for the sidelines and a 100% cash position as our Trend Tracking Indexes (TTIs) suggest:
Domestic TTI: +0.42% (last week +2.65%)
International TTI: +2.23% (last week +5.14%)
Another unusual occurrence was the fact the some of our low volatility holdings displayed far more volatility during the various sell offs over the past month than they should have—according to the theory. I am not sure why that is, but I attribute it to the distorted and manipulated financial market environment in general.
Have a great week.
Ulli…
————————————————————-
READER Q & A FOR THE WEEK
All Reader Q & A’s are listed at our web site!
Check it out at:
http://www.successful-investment.com/q&a.php
A note from reader Thomas:
Q: Ulli: Good morning. I need your opinion; I have a large share of my fixed income invested in HYG & JNK. Should I sell both positions at this time? Thank you.
A: Thomas: As you know, I let my trailing sell stops make those decisions for me, so that I don’t have to be emotionally involved. Depending on your risk tolerance, you can use a 5% or 7% trailing stop.
Figure out your high point from the time you purchased these ETFs, reduce that number by the dividends received, and then apply your sell stop. If it gets triggered, you sell; if not, you continue to hold. That’s what I would do.
———————————————————-
WOULD YOU LIKE TO HAVE YOUR INVESTMENTS PROFESSIONALLY MANAGED?
Do you have the time to follow our investment plans yourself? If you are a busy professional who would like to have his portfolio managed using our methodology, please contact me directly or get more details at:
https://theetfbully.com/personal-investment-management/
———————————————————
Back issues of the ETF/No Load Fund Tracker are available on the web at:
https://theetfbully.com/newsletter-archives/

 Invesco PowerShares Capital Management LLC, the Wheaton, Illinois-based sponsor of quantitative rules-based exchange traded-funds, has launched a short-term, high-yield/junk global bond ETF in an effort to bring more variety in the short-term yield-focused fixed-income world that’s currently dominated by a handful of successful ETFs.