 The ETF/No Load Fund Tracker
Monthly Review—April 30, 2013
US Equities Extend Gains In April; Europe Hums Along
US stocks finished April higher with the S&P 500 index posting its longest monthly winning streak since September 2009, as markets cheered corporate earnings and the Fed’s continuing monetary stimulus.
Analysts believe the bull market, which entered a fifth year in March, has mostly been driven by strong corporate earnings and three rounds of quantitative easing by the Federal Reserve. I, however, remain skeptical and wonder what will be the catalyst for the bull’s next leg up if all the quantitative easing could get only 2 percent annualized GDP growth at best with major companies falling short of revenue targets?
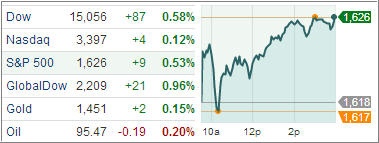
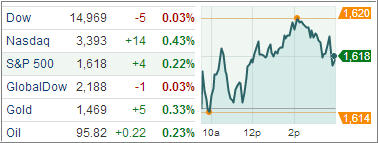
The S&P 500 added 3.96 points on the last trading day of the month, tallying its April gains to 1.8 percent and marking its longest winning run since a seven-month stretch that ended in September 2009. The benchmark index is up more than 13 percent for the year. The Dow Jones Industrial Average also added 1.8 percent for the month while the tech-laden NASDAQ Composite Index climbed 1.9 percent in April.
Economic data for April continued to be mixed. The Chicago-area manufacturing PMI slumped to 49.0 in April from 52.4 in March, its worst level in more than three years. On the upside, the S&P Case-Shiller home-price index climbed 0.3 percent in February, capping annual gains at 9.3 percent. The consumer confidence index surged to 68.1 in April from an upwardly revised 61.9 in March. Consumer confidence had nosedived in March in part because of the so-called sequester that requires billions of dollars in government spending cuts.
An advance report showed first-quarter GDP rose at an annualized 2.5 percent pace, up from the 0.4 percent gain in the final quarter of last year. However, things may change significantly during the second quarter, and the economy may experience a pullback as consumption and inventory growth slows down. Government spending, which slipped 4.1 percent in the first quarter, is set to fall by a larger amount in the second quarter as the effects of sequestration become more pronounced.
The all-important jobs market continues to vacillate though unemployment rate is showing signs of improvement. Non-farm payrolls increased unexpectedly by 165,000 last month, after an upwardly revised 138,000 gain in March. The unemployment rate fell to 7.5 percent in April from 7.6 percent the prior month, the lowest level since December 2008.
However, a deeper look reveals some not-so-encouraging facts. Total hours worked failed sharply in April while US workers actually earned less than the month before. Employers cut everyone’s hours by 12 minutes on an average. Spread over a 135-million strong workforce, that is equivalent to firing more than 500,000 workers while keeping hours steady.
European exchanges tracked US equities in April though economic data from the region showed further deterioration, though political uncertainty receded somewhat. Eurozone unemployment rate climbed to a record 12.1 percent in March while economic confidence in the currency bloc fell more than expected in April. The European Commission said a gauge of consumer and business sentiment slipped to 88.6 from a revised 90.1 in March.
With all that uncertainty, our increased exposure in low volatility ETFs turned out to be the right move. Our investments in consumer staples (XLP), the S&P low volatility index (SPLV), Vanguard REIT index (VNQ) and health care (XLV), just to name a few, provided us with some nice gains during the month of April.
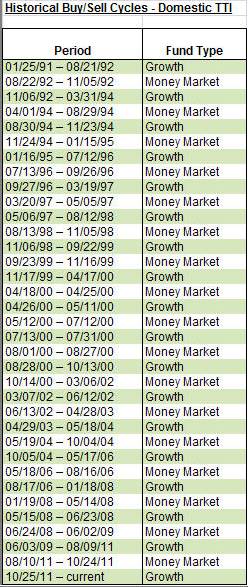
Trend wise, the bull is still alive and well, as our main tracking indicator clearly shows:
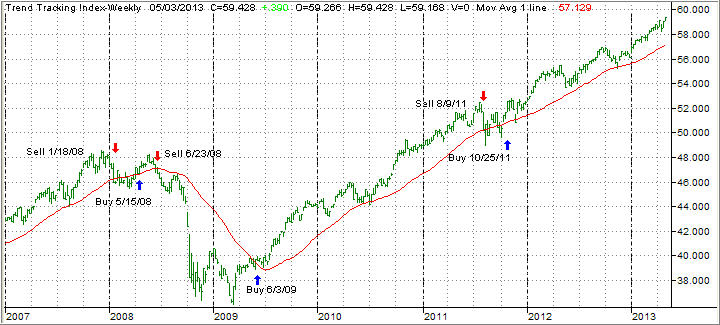
The index (green line) remains firmly above its trend line (red), which means the major market trend is up, so we will remain fully invested for the time being. Of course, should a reversal materialize our trailing sell stops are identified for each holding and will be executed as it becomes necessary.