Poor Macro Data Knock Down the Bulls

Ulli Market Commentary Contact

Wed pic

[Chart courtesy of MarketWatch.com]

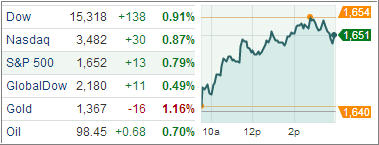
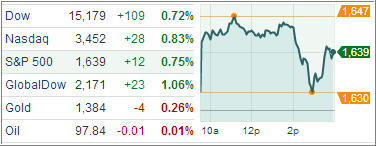
Disappointing economic data finally dragged stocks down. The Dow Jones Industrial Average was down 138 points (0.9%) to 14,701, the S&P 500 Index lost 15 points (0.9%) from its record high to 1,583, and the Nasdaq Composite decreased 30 points (0.9%) to 3,299. Volume came in slightly lower than Tuesday. Commodity companies dropped the most among 10 S&P 500 industries as oil and copper tumbled.

The latest economic data continued a trend of indicators pointing to anemic growth. The ISM Manufacturing Index fell 0.6 points in April to 50.7. It was the lowest level this year, as factory activity expanded for the fifth straight month, but at a slower pace as the manufacturing recovery has lost some momentum.

The decline was led by a sharp 4.0-point drop in the employment index, the most since September 2010. The inventory index fell 3.0 points as businesses ran down stocks for the second month in a row. Inventories continue to decline on a 12-month average basis, indicating a negative trend. Construction spending fell 1.7% in March, likely driven by funding cutbacks due to the sequester. The weakness was widespread. Public spending tumbled 4.1%, the most in 11 years, to its lowest level since October 2006. Residential spending slowed sharply to 0.4%. Private nonresidential fell 1.5%.

Read More

7 ETF Model Portfolios You Can Use – Updated through 4/30/2013

Ulli Model ETF Portfolios Contact

And the beat goes on. No matter how bad economic news is, it simply does not matter as the feeding frenzy caused by the Fed’s endless printing efforts continues unabated. It has come to the point where only Fed policy is in charge of market direction; nothing else appears to have any effect.

Good thing that we are not involved in the minutiae of analyzing economic fundaments to arrive at investment decisions; we simply follow the trend for as long as it lasts while realizing that, eventually, all good things will come an end, which is the precise moment when our trailing sell stops will take us out of our equity positions.

In the meantime, the S&P 500 managed to gain another 1.14% since last week’s ETF Model Portfolio report, with our model #5 now being close to catching the S&P YTD. Second best performer has been the conservative growth portfolio #2, which sports a nice return given its conservative nature.

Take a look at the latest update:

Read More

More Bad Economic News = More Gains in the Market

Ulli Market Commentary Contact

Tue pic

[Chart courtesy of MarketWatch.com]

The bulls simply don’t know how or when not quit as stocks ended Tuesday’s session on a modestly higher note in the face of another day of mushy global economic data. The Dow Jones Industrial Average moved up 21 points (or 0.1%) to 14,839, the Nasdaq Composite gained 22 points (0.7%) to 3,329, and the Standard & Poor’s 500 Index added 4 points (0.3%) to 1,598, sending the S&P index to another record. In moderate volume, more than 6.7 billion shares changed hands on U.S. exchanges, or 5 percent higher than the three-month average. Techs led the way again with Apple launching $17 billion of bonds in the biggest corporate offering on record.

A decline in regional business activity underlined the growth concerns of the economy. The Chicago Business Barometer dropped 3.4 points in April to 49.0, falling into contraction territory for the first time since September 2009. Economists forecasted a small uptick to 52.8.

Production, supplier deliveries, inventories, and order backlogs indexes were at their lowest levels since 2009. Employment fell for the second time in the past five months. Price pressures eased, as the prices index fell to 51, the lowest level since October 2009, reflecting softer demand. Milwaukee activity contracted for the first time in five months, as the composite index declined 2.6 points to 48.4. New orders, production and employment each shrank but, thanks to the stimulative efforts of the Fed, none of the above matter anymore.

Read More

Markets Hit New Record Though It Was A One-Sided Affair

Ulli Market Commentary Contact

Mon pic

[Chart courtesy of MarketWatch.com]

Stocks climbed throughout the session today to kick off the week with solid gains despite mixed economic data. The Standard & Poor’s 500 Index rose 11 points to 1,594 surpassed its previous record close set earlier this month.

Growth-oriented stocks, including energy and technology, lead the way to the index’s sixth rise in the past seven sessions. The Dow Jones Industrial Average gained 106 points (0.7%) to 14,819, and the Nasdaq Composite hit a new multiyear high on an intraday basis, ending with a gain of 0.9% to 3,307. Disappointing volume, however, once again revealed a lack of conviction behind the buying. 598 million shares were traded on the NYSE, and 1.5 billion shares changed hands on the Nasdaq.

Pending home sales rose 1.5% in March compared with February and were 7% higher compared with the same time last year, above the consensus forecast of 1.0%. Contract signing activity reached its highest level since April 2010, which was infused by the home-buyer tax credit. Personal income rose 0.2% in March, down from 1.1% in the previous month, and below the consensus of 0.4%. However, it was in line with the 12-month average, indicating stable growth.

Read More

ETFs/Mutual Funds On The Cutline – Updated Through 4/26/2013

Ulli ETFs on the Cutline Contact

Below are the latest ETF Cutline reports, which show how far above or below their respective long-term trend lines (39 week SMA) my currently tracked ETFs/MFs are positioned.

The first report covers the ETF Master List from Thursday’s StatSheet and includes 398 ETFs, of which currently 343 (last week 322) of them are hovering in bullish territory.

The second report includes only High Volume ETFs. To clarify, High Volume (HV) ETFs are defined as those with an average daily volume of $10 million or higher.

These ETFs are generated from my selected list of some 93 that I use in my advisor practice. It cuts out the “noise,” which simply means it eliminates those ETFs that I would never buy because of their volume limitations. 67 ETFs (last week 62) have managed to remain in bullish territory after the recent market volatility.

The third report covers Mutual Funds on the Cutline. There are currently 809 (last week 772) above the line and 50 below it out of the 859 that I follow.

Take a look:

1. ETF Master Cutline Report

2. ETF High Volume Cutline Report

3. MF Cutline Report

In case you are not familiar with some of the terminology used in the reports, please read the Glossary of Terms.

Last Week In Review: ETF News And Blog Posts To 4/28/2013

Ulli Market Review Contact

In case you missed it, here’s a summary of the ETF topics and market reviews I posted to my blog during the week ending on 4/28/2013.

The prior week’s damage was almost made up during the past five trading days as the indexes found upward momentum again with the S&P 500 adding some 1.7%.

The hunt to break the S&P’s 1,600 milestone marker is still on, and it remains to be seen if that level still can be broken during the month of April even though there are only two trading days left. Once we slip into May, the prevailing attitude for many investors could be “sell in May and go away.”

Personally, I prefer to stay away from such guesswork since you can never be sure if the widely anticipated downward move will materialize. As I have posted ad nauseum, I will stay with the trend and let the trailing sell stops be my guide as to when to exit.

Over past week, we covered the following:

Read More