ETF/No Load Fund Tracker Newsletter For Friday, June 28, 2013
ETF/No Load Fund Tracker StatSheet
————————————————————-
THE LINK TO OUR CURRENT ETF/MUTUAL FUND STATSHEET IS:
https://theetfbully.com/2013/06/weekly-statsheet-for-the-etfno-load-fund-tracker-newsletter-updated-through-06272013/
————————————————————
Market Commentary
Friday, June 28, 2013
STOCKS END MIXED BUT BEST FIRST HALF SINCE 1998
U.S. equities had a rollercoaster week that ended on a downward slope. Traders grappled with a plethora of disappointing corporate earnings releases and a larger-than-anticipated decline in regional manufacturing activity, which overshadowed an upward revision to US consumer sentiment.
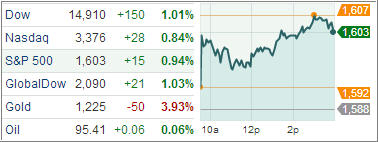
The Dow Jones Industrial Average closed 115 points lower (0.7%) at 14,909, the Standard & Poor’s 500 Index decreased 7 points (0.4%) to 1,606, and the Nasdaq Composite was nearly flat at 3,403. In heavy volume due to index rebalancing, 1.7 billion shares changed hand on the NYSE, and 2.5 billion shares were traded on the Nasdaq.
The Dow along with the S&P 500 ended Friday’s session with their best first half performance of any year since 1998 after reaching record highs in May on a rally underpinned by the Fed’s massive monetary stimulus. Stocks slipped out of the gate amid weakness in Treasuries. The 10-yr note sold off into the cash session open before erasing most of its losses. The benchmark 10-yr yield ended higher by two basis points at 2.493%. The losses on equities were broad, with eight of the 10 S&P 500 industrial sectors declining. Only utilities and consumer discretionary shares closed higher.
On the positive note, the Reuters/University of Michigan Consumer Sentiment Index rose 1.4 points from the preliminary reading to 84.1 in June, the second highest level since July 2007. The index slipped 0.4 points for the month. On a y/y basis, the index is up 14.9%, indicating a bullish mode for the economy. The Chicago Purchasing Managers Index showed a slowdown in manufacturing activity growth that was more than expected, decreasing to 51.6 in June, from the unrevised 58.7 in May. Economists had forecasted a decline to 55.0. Now let’s look at the week in review.
The markets recovered some of the recent sell-off this week as a plethora of upbeat domestic economic painted a better picture of the economy. Stocks were also able to show some resiliency in the face of festering credit crisis concerns out of China, as well as the increased likelihood of asset purchase tapering by the Fed.
Good news included durable goods orders that came in stronger than expected, personal consumption and spending rose, jobless claims declined, while Consumer Confidence jumped to the highest level since January 2008.
For the week, the Dow rose 0.7 percent, the S&P 500 gained 0.9 percent and the Nasdaq advanced 1.4 percent. However, both the S&P 500 and Nasdaq snapped a seven-month winning streak, while the Dow broke a six-month surge. For the month, the Dow fell 1.4 percent, the S&P 500 lost 1.5 percent and the Nasdaq dropped 1.5 percent.
Markets will have a mid-week break, with a shortened day on Wednesday and closure on Thursday, to celebrate Independence Day. The week will end with jobs data.
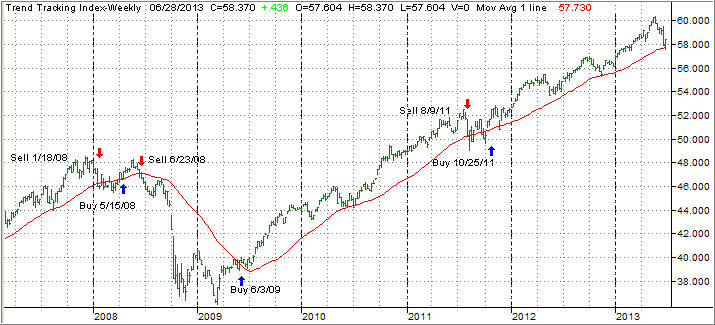
We saw the Domestic TTI briefly dip into bear market territory on Monday before the rebound pushed the markets higher, which was caused by various Fed governors jawboning about the lack of understanding Wall Street had about the Fed’s tapering intentions. In other words, it was nothing but damage control that provided this week’s possible dead cat bounce.
We’ll have to see if that damage control can hold up the major indexes once we get past the 4th of July weekend and into the slow summer days.
Ending the quarter, our Trend Tracking Indexes (TTIs) closed as follows:
Domestic TTI: +0.84% (last week +0.42%)
International TTI: +2.88% (last week +2.23%)
Have a great week.
Ulli…
————————————————————-
READER Q & A FOR THE WEEK
All Reader Q & A’s are listed at our web site!
Check it out at:
http://www.successful-investment.com/q&a.php
A note from reader Maghar:
Q: Ulli: Your recent comment that normally conservative securities have shown twice the volatility, like SPLV was down about 8% compared to SPY about 4. I wonder how that could happen?
A: Maghar: We are having a totally distorted and manipulated market environment and risk on and risk off tendencies switch at a moment’s notice so that alleged less volatile ETFs all of a sudden can get very volatile.
———————————————————-
WOULD YOU LIKE TO HAVE YOUR INVESTMENTS PROFESSIONALLY MANAGED?
Do you have the time to follow our investment plans yourself? If you are a busy professional who would like to have his portfolio managed using our methodology, please contact me directly or get more details at:
https://theetfbully.com/personal-investment-management/
———————————————————
Back issues of the ETF/No Load Fund Tracker are available on the web at:
https://theetfbully.com/newsletter-archives/

 Markets turned volatile across the globe after the Federal Reserve indicated it may slow down its asset purchase program later this year. A tapering of QE3 is likely to be followed by a hike in interest rates, which in turn will put downward pressure on fixed-income portfolios. Investors are naturally worried about greater volatility and are seeking stability while protecting their income.