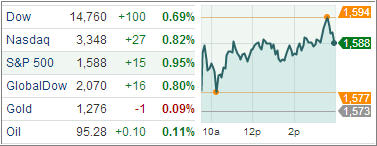
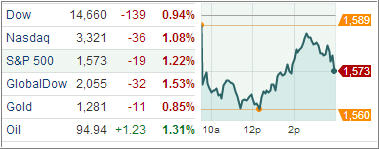
ETFs/Mutual Funds On The Cutline – Updated Through 5/17/2013

Ulli ETFs on the Cutline Contact

Below are the latest ETF Cutline reports, which show how far above or below their respective long-term trend lines (39 week SMA) my currently tracked ETFs/MFs are positioned.

The first report covers the ETF Master List from Thursday’s StatSheet and includes 398 ETFs, of which currently 341 (last week 342) of them are hovering in bullish territory.

The second report includes only High Volume ETFs. To clarify, High Volume (HV) ETFs are defined as those with an average daily volume of $10 million or higher.

These ETFs are generated from my selected list of some 93 that I use in my advisor practice. It cuts out the “noise,” which simply means it eliminates those ETFs that I would never buy because of their volume limitations. 69 ETFs (last week 72) have managed to remain in bullish territory after the recent market volatility.

The third report covers Mutual Funds on the Cutline. There are currently 826 (last week 827) above the line and 33 below it out of the 859 that I follow.

Take a look:

1. ETF Master Cutline Report

2. ETF High Volume Cutline Report

3. MF Cutline Report

In case you are not familiar with some of the terminology used in the reports, please read the Glossary of Terms.

Last Week In Review: ETF News And Blog Posts To 5/19/2013

Ulli Market Review Contact

In case you missed it, here’s a summary of the ETF topics and market reviews I posted to my blog during the week ending on 5/19/2013.

It seems like I am saying the same thing every week as the major equity indexes are being propelled deeper into record territory. A short pause this week did nothing to reverse the major trend; it only offered an opportunity to deploy more money before the S&P 500 regained momentum by adding another 2%.

Again, my theme remains the same in that we are participating in this rally via low volatility ETFs, which surprisingly have outperformed the S&P YTD. For example, XLP, which we own, is up slightly over 20% vs. the S&P’s 17%.

Yes, that is YTD, as unbelievable as it may sound. Of course, there will be a correction at some point after this parabolic rally, which makes it an absolute must to have an exit strategy in place. If you don’t have one, you are not thinking clearly and are taking a huge risk.

Over past week, we covered the following:

Read More

One Man’s Opinion: Can High Yield Bonds Give Decent Returns In A Low Interest Environment?

Ulli Market Commentary Contact

92835431It’s difficult to spot an upside in the high yields market since there has been an enormous rally in the segment with all time high dollar prices and all time low yields in the history of these industries.

Still, compared to other bond markets, the high-yield segment offers better returns, says Jeff Peskind, Chief Investment Officer and Founder of Phoenix Investment Advisers. In a low interest rate environment, it’s better to take credit risk with junk bonds than to take duration risk with higher rated bonds because if interest rates go up, junk bonds on credit is where investors really need to be, he observed.

Asked if there’s a little bit of frothiness in the corporate credit market as many companies are taking advantage of the low interest rate environment to refinance and issue new debt, Jeff said there’s little bit of fizz in the market because the structures in some of these companies are a little bit weaker than they were a few years ago. But the situation is different from 2007 since a lot of companies had a lot of leverage and very little liquidity then. The same companies are in a much better financial shape today because they are very liquid and they have a lot of time left to go before the big maturities. So it’s a weird world where the credit quality is good, the dollar price is high, the yield is low, but it’s still not a bad place to be in, he noted.

Read More

New ETFs On The Block: Vanguard Emerging Markets Government Bond Index Fund (VWOB)

Ulli Bond ETFs Contact

137430914Vanguard, the Valley Forge, Pennsylvania-based third largest exchange traded funds issuer with nearly $286 billion in ETF assets, and one of the biggest asset management firms in the world, will roll out its much-awaited emerging markets bond ETF in early June, once the ‘subscription period’ of its mutual fund with the same strategy is complete.

The ETF shares of Vanguard Emerging Markets Government Bond Index Fund (VWOB) is in a so-called ‘subscription period’ from May 14 until May 30. During this period, the fund aims to accumulate enough assets to build a representative and diversified portfolio that will track the Barclays USD Emerging Markets Government RIC Capped Index. Until then, the portfolio will invest in money market funds.

The underlying benchmark comprises about 560 government, agency and local authority issuers and consists only of US dollar denominated emerging market bonds. The index will limit weightings of individual issuers when necessary to meet the IRS investment company diversification requirements.

Read More

05-17-2013

Ulli Newsletter Archives Contact

ETF/No Load Fund Tracker Newsletter For Friday, May 17, 2013

ETF/No Load Fund Tracker StatSheet

————————————————————-

THE LINK TO OUR CURRENT ETF/MUTUAL FUND STATSHEET IS:

https://theetfbully.com/2013/05/weekly-statsheet-for-the-etfno-load-fund-tracker-newsletter-updated-through-05162013/

————————————————————

Market Commentary

Friday, May 17, 2013

BULLS NOWHERE TO GO BUT UP

Stocks continued their climb into uncharted territory today and more than made up for yesterday’s sell off. The Dow Jones Industrial Average and the Standard & Poor’s 500 finished at fresh record highs, driven by gains in energy and industrial shares. The indexes have pushed to a series of never-before-seen levels as part of the rally that has lifted equities more than 16 percent for the year so far.

The Dow closed higher by 121 points (0.8%) at 15,354, the S&P 500 Index increased 15 points (1.0%) to 1,666, and the Nasdaq Composite ascended 34 points (1.0%) to 3,499. Volume was 7% lower on the Nasdaq but 17% higher on the NYSE compared to Thursday, according to preliminary data. The volume data may have been skewed by the expiration of stock options.

The market has been racking up gains for the fourth week in a row as consumer confidence rose higher than expected and a gauge of future economic activity rebounded. The Reuters/University of Michigan Consumer Sentiment Index jumped 7.3 points in the preliminary May reading to 83.7, the highest level since July 2007.

Economists expected a modest 1.6-point gain to 78.0. If the reading is maintained for the full month, it would be the biggest increase since September 2009. The latest sentiment reading corresponds to 3.3% real GDP growth and suggests improved economic activity in the fall. One-year inflation expectations were stable at 3.1%. The Conference Board’s Leading Economic Index (LEI) rose 0.6% in April, double the consensus. The index is at its highest level since June 2008. Seven of its ten components improved, led by building permits, interest rate spread, and jobless claims. The report suggests “economic growth will remain positive in the upcoming months and may even pick up slightly toward the end of the year.”

Despite some disappointing global economic data and festering uncertainty regarding when the Fed will take its foot off of the economic stimulus accelerator, stocks continued to post record highs this week.

The bulls shrugged off a plethora of data: the Chinese economy continued to slow, the Eurozone recession hit a record length, Japanese business spending remained sluggish, and manufacturing activity in New York and Philadelphia unexpectedly contracted.

But recent improvement, including in the labor market and retail sales, has suggested the recovery remains resilient. For the week, the Dow advanced 1.6 percent, while the S&P 500 climbed 2 percent and the Nasdaq rose 1.8 percent. JPMorgan raised its year-end target for the S&P 500 to 1,715 from 1,580, implying a gain of less than 3.5 percent for the index for the rest of the year.

Our Trend Tracking Indexes (TTIs) headed higher with the market indexes and closed the week as follows:

Domestic TTI: +5.07% (last week +4.56%)

International TTI: +10.09% (last week +9.30%)

We remain fully invested subject to our trailing sell stops.

Have a great week.

Ulli…

————————————————————-

READER Q & A FOR THE WEEK

All Reader Q & A’s are listed at our web site!
Check it out at:

http://www.successful-investment.com/q&a.php

A note from reader Ed:

Q: Ulli: What are your thoughts on the PRPFX Fund with gold having dropped so fast??

A: Ed: I don’t own it, since it is hovering below its long-term trend line. There are far better opportunities in low volatility ETFs.

———————————————————-

WOULD YOU LIKE TO HAVE YOUR INVESTMENTS PROFESSIONALLY MANAGED?

Do you have the time to follow our investment plans yourself? If you are a busy professional who would like to have his portfolio managed using our methodology, please contact me directly or get more details at:

https://theetfbully.com/personal-investment-management/

———————————————————

Back issues of the ETF/No Load Fund Tracker are available on the web at:

https://theetfbully.com/newsletter-archives/

ETF/No Load Fund Tracker Newsletter For Friday, May 17, 2013

Ulli ETF Tracker Contact

ETF/No Load Fund Tracker StatSheet

————————————————————-

THE LINK TO OUR CURRENT ETF/MUTUAL FUND STATSHEET IS:

https://theetfbully.com/2013/05/weekly-statsheet-for-the-etfno-load-fund-tracker-newsletter-updated-through-05162013/

————————————————————

Market Commentary

Friday, May 17, 2013

BULLS NOWHERE TO GO BUT UP

Stocks continued their climb into uncharted territory today and more than made up for yesterday’s sell off. The Dow Jones Industrial Average and the Standard & Poor’s 500 finished at fresh record highs, driven by gains in energy and industrial shares. The indexes have pushed to a series of never-before-seen levels as part of the rally that has lifted equities more than 16 percent for the year so far.

The Dow closed higher by 121 points (0.8%) at 15,354, the S&P 500 Index increased 15 points (1.0%) to 1,666, and the Nasdaq Composite ascended 34 points (1.0%) to 3,499. Volume was 7% lower on the Nasdaq but 17% higher on the NYSE compared to Thursday, according to preliminary data. The volume data may have been skewed by the expiration of stock options.

The market has been racking up gains for the fourth week in a row as consumer confidence rose higher than expected and a gauge of future economic activity rebounded. The Reuters/University of Michigan Consumer Sentiment Index jumped 7.3 points in the preliminary May reading to 83.7, the highest level since July 2007.

Read More