ETF/No Load Fund Tracker Newsletter For Friday, December 6, 2013
ETF/No Load Fund Tracker StatSheet
————————————————————-
THE LINK TO OUR CURRENT ETF/MUTUAL FUND STATSHEET IS:
————————————————————
Market Commentary
Friday, December 6, 2013
MARKETS BACK ON TOP AFTER A SHAKY WEEK

1. Moving The Markets
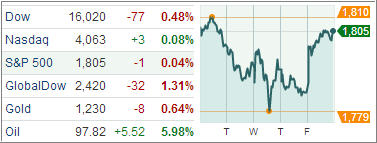
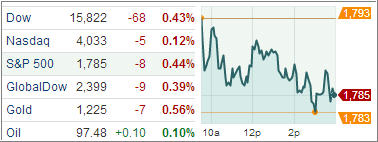
It was just one day, yet there was ample meaning wrapped up in the connection that the 10-yr Treasury note (+3/32, 2.87%) and the stock market both pushed higher. Gold prices and the US Dollar Index, meanwhile, were little changed. This is a positive end to a somewhat sour week that saw the S&P and Dow both swim in the red daily.
The headlines for the employment data this week were reassuring on just about every front. Nonfarm payrolls increased by 203,000 (Briefing.com consensus 188,000) and were revised up for September (to 175,000 from 163,000) and down slightly for October (to 200,000 from 204,000). Nonfarm private payrolls increased by 196,000 (Briefing.com consensus 200,000). The unemployment rate fell to 7.0% from 7.3%
Bitcoin’s value took a tumble this week after the People’s Bank of China issued an official statement about its stance on the digital coin, knocking the cryptocurrency’s value down into the $800s after lofty $1,200 highs. China has been largely responsible for Bitcoin’s dramatic 500% rise in value over the last month, with yuan dominating the trading markets, according to the Genesis Block. China’s government evidently felt that the cryptocoin was getting too hot to ignore.
Our ETFs in the spotlight headed back up to close near their yearly highs:
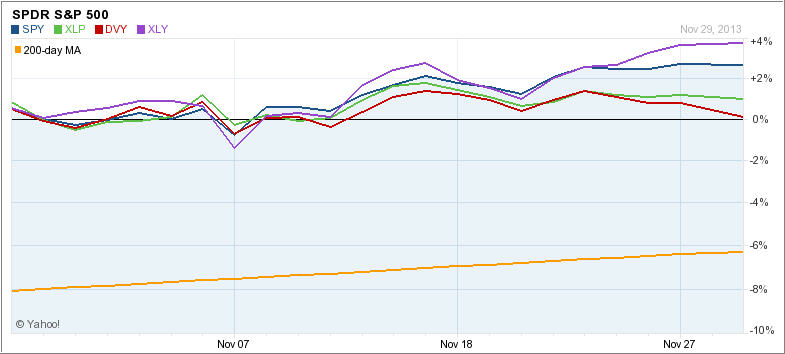
2. ETFs in the Spotlight
In case you missed the announcement and description of this section, you can read it here again.
It features 10 broadly diversified ETFs from my HighVolume list as posted every Monday. Furthermore, they are screened for the lowest MaxDD% number meaning they have been showing better resistance to temporary sell offs than all others over the past year.
In other words, none of them ever triggered their 7.5% sell stop level during this time period, which included a variety of severe market pullbacks but no move into outright bear market territory.
Here are the 10 candidates:
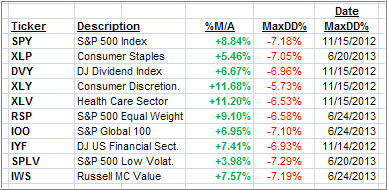
All of them are in “buy” mode meaning their prices are above their respective long term trend lines by the percentage indicated (%M/A).
Now let’s look at the MaxDD% column and review the ETF with the lowest drawdown as an example. As you can see, that would be XLY with the lowest MaxDD% number of -5.73%, which occurred on 11/15/2012.
The recent sell off in the month of June did not affect XLY at all as its “worst” MaxDD% of -5.73% still stands since the November 2012 sell off.
A quick glance at the last column showing the date of occurrences confirms that five of these ETFs had their worst drawdown in November 2012, while the other five were affected by the June 2013 swoon, however, none of them dipped below their -7.5% sell stop.
Year to date, here’s how the above candidates have fared so far:
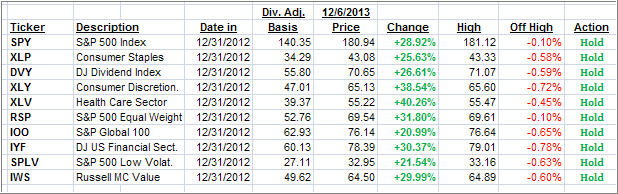
We are almost back to last week’s highs as the selloff was minor and did not affect the values in the all important “Off High” column by a significant amount.
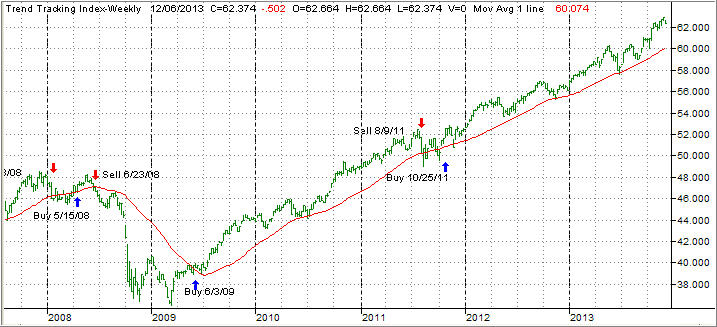
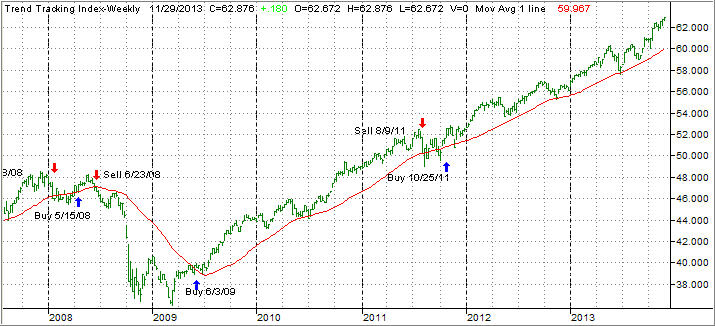
3. Domestic Trend Tracking Indexes (TTIs)
Trend wise, our Trend Tracking Indexes (TTIs) slipped week over week despite today’s sharp rebound. They remain above their long term trend lines by the following percentages:
Domestic TTI: +4.34% (last Friday +5.07%)
International TTI: +5.96% (last Friday +7.93%)
Have a great week.
Ulli…
Disclosure: I am obliged to inform you that I, as well as advisory clients of mine, own some of these listed ETFs. Furthermore, they do not represent a specific investment recommendation for you, they merely show which ETFs from the universe I track are falling within the guidelines specified.
————————————————————-
READER Q & A FOR THE WEEK
All Reader Q & A’s are listed at our web site!
Check it out at:
http://www.successful-investment.com/q&a.php
A note from reader Mike:
Q: Ulli: What is the difference between the “DD%” and the “trailing stop loss %”?
A: Mike: The DD% refers to the percentage a fund has come off its high. This is the high a fund has made since you purchased it, and it serves as a basis for calculating the trailing sell stop. For example, let’s assume you bought an ETF for $10 and it subsequently moves as follows for the next trading days: 10.05, 9.98, 10.15, 10.21, 10.30, 10.19, 10.14…
The high it has made in this data series is 10.30, which becomes the basis for calculating your 7.5% trailing sell stop, which would be at 9.52. If prices sink through 9.52, without taking out the high of 10.30 first, that would be your trigger point to exit the position.
In my weekly StatSheet listings, you can see the percentage a fund has come off its high in the DD% column. Once that number exceeds -7.5%, it means a sell signal for that fund has been generated. To be clear, if you bought this fund at a different time than shown in the StatSheet, you need to track your own highs (no pun intended) as mentioned above.
Hope this clarifies it.
———————————————————-
WOULD YOU LIKE TO HAVE YOUR INVESTMENTS PROFESSIONALLY MANAGED?
Do you have the time to follow our investment plans yourself? If you are a busy professional who would like to have his portfolio managed using our methodology, please contact me directly or get more details at:
https://theetfbully.com/personal-investment-management/
———————————————————
Back issues of the ETF/No Load Fund Tracker are available on the web at: