ETFs/Mutual Funds On The Cutline – Updated Through 01/03/2014

Ulli ETFs on the Cutline Contact

Below are the latest ETF Cutline reports, which show how far above or below their respective long-term trend lines (39 week SMA) my currently tracked ETFs/MFs are positioned.

The first report covers the ETF Master List from Thursday’s StatSheet and includes 398 ETFs, of which currently 317 (last week 331) are hovering in bullish territory.

The second report includes only High Volume ETFs. To clarify, High Volume (HV) ETFs are defined as those with an average daily volume of $10 million or higher.

These ETFs are generated from my selected list of some 93 that I use in my advisor practice. It cuts out the “noise,” which simply means it eliminates those ETFs that I would never buy because of their volume limitations. 61 ETFs (last week 60) have managed to remain in bullish territory after the recent market volatility.

The third report covers Mutual Funds on the Cutline. There are currently 679 (last week 708) above the line and 170 below it out of the 859 that I follow.

Take a look:

1. ETF Master Cutline Report     

2. ETF High Volume Cutline Report

3. MF Cutline Report

In case you are not familiar with some of the terminology used in the reports, please read the Glossary of Terms.

If you missed the original post about the Cutline approach, you can read it here.

Please note that Mutual fund prices have not been adjusted for yearend distributions.

One Man’s Opionion: Why Are European Banks Unwilling To Lend To Corporations?

Ulli Market Review Contact

A broadly positive outlook for 2014 doesn’t92835431 necessarily mean investors exit the fixed-income market as Friday’s data (a sharp drop in Spanish unemployment claims in December) showed Spanish government bonds could do relatively well compared to the core countries, said Georg Grodzki, Head of Credit Research at UK’s Legal & General Investment Management.

The peripheral government bonds should offer some good opportunities though investors should be cautious as risks in the government bond markets will probably rise during the course of the year due to buoyant economic data.

Central banks will face challenges when they try to ensure yield rises are orderly and not sudden and steep. Spanish government bonds may deliver negative returns at a future date as well. However, if investors are looking for opportunities in the short-run, being overweight in peripheral government bonds may be a good idea, he said.

Read More

New ETFs On The Block: Wisdomtree Bloomberg US Dollar Bullish Fund (USDU)

Ulli US Dollar Contact

146026450WisdomTree, the NY-based fifth largest exchange-traded fund sponsor and asset manager with 61 different products that span asset classes and countries, is back with its latest launch – the WisdomTree Bloomberg US Dollar Bullish Fund (USDU). The fund aims to benefit by providing exposure to the US dollar’s appreciation against a broad basket of 10 developed and emerging market currencies.

USDU tracks the Bloomberg Dollar Total Return Index and follows an active management strategy to measure the greenback’s performance against a diversified basket of currencies with the most liquidity and largest US trade flows. It invests in Treasury bills and other investment-grade money market securities, including short-term corporate-debt papers while taking positions in short-term currency forwards.

The underlying index follows a rules-based process and is rebalanced annually to reflect the dynamic nature of today’s global currency markets. Currently, the fund has the highest exposure in the euro (31.23 percent), followed by the Japanese yen (19.24 percent) and the Canadian dollar (11.52 percent). The remaining seven currencies in the index get exposure in single digits. Also, exposure to the Chinese yuan is capped at 3 percent while currencies that are pegged to the US dollar – such as the Hong Kong dollar and the Saudi riyal, are removed from the probable’s list.

Read More

01-03-2014

Ulli Newsletter Archives Contact

ETF/No Load Fund Tracker Newsletter For Friday, January 3, 2014

ETF/No Load Fund Tracker StatSheet

————————————————————-

THE LINK TO OUR CURRENT ETF/MUTUAL FUND STATSHEET IS:

https://theetfbully.com/2014/01/weekly-statsheet-for-the-etfno-load-fund-tracker-newsletter-updated-through-01022014/

————————————————————

Market Commentary

Friday, January 3, 2014

A CHOPPY WEEK ON WALL STREET

Fri pic

[Chart courtesy of MarketWatch.com]

1. Moving The Markets

Overall, volumes on Wall Street were thin this week, with many traders still on vacation. Also, a major storm in the Northeast hampered travel and states of emergency were declared in New York and New Jersey.

U.S. stocks ended a choppy trading session mostly lower on Friday after Federal Reserve Chairman Ben Bernanke defended the extraordinary measures undertaken by the central bank to boost the economic recovery. The S&P 500 (SPX) slipped less than a point leaving it down 0.6% for the week. The Dow Jones Industrial Average (DJIA) closed up 0.2% but finished the week marginally lower and the tech-heavy Nasdaq Composite (COMP) shed 0.3% on Friday and lost 0.8% for the week.

In the ETF world, WisdomTree, an exchange-traded fund sponsor and asset manager, has announced the launch of the WisdomTree Bloomberg US Dollar Bullish ETF (USDU). The fund, which is linked to the Bloomberg Dollar Total Return Index, seeks to provide exposure to the US dollar against a broad basket of developed and emerging market currencies based on global trade flows and liquidity measures. The nascent actively managed ETF space is just beginning to expand, and you should expect more options as money managers try to edge into mutual fund territory with a cheaper investment wrapper.

As we continue on into 2014, you will most likely see more actively managed ETFs that cover target income, commodities, emerging markets, managed futures, hedged products and other alternatives.

Our 10 ETFs in the Spotlight came off their highs to varying degrees but all remain on the bullish side of their respective trend lines.

2. ETFs in the Spotlight

In case you missed the announcement and description of this section, you can read it here again.

It features 10 broadly diversified ETFs from my HighVolume list as posted every Monday. Furthermore, they are screened for the lowest MaxDD% number meaning they have been showing better resistance to temporary sell offs than all others over the past year.

In other words, none of them ever triggered their 7.5% sell stop level during this time period, which included a variety of severe market pullbacks but no move into outright bear market territory.

Here are the 10 candidates:

MaxDD

All of them are in “buy” mode meaning their prices are above their respective long term trend lines by the percentage indicated (%M/A).

Now let’s look at the MaxDD% column and review the ETF with the lowest drawdown as an example. As you can see, that would be XLY with the lowest MaxDD% number of -5.73%, which occurred on 11/15/2012.

The recent sell off in the month of June did not affect XLY at all as its “worst” MaxDD% of -5.73% still stands since the November 2012 sell off.

A quick glance at the last column showing the date of occurrences confirms that five of these ETFs had their worst drawdown in November 2012, while the other five were affected by the June 2013 swoon, however, none of them dipped below their -7.5% sell stop.

Year to date, here’s how the above candidates have fared so far:

YTD

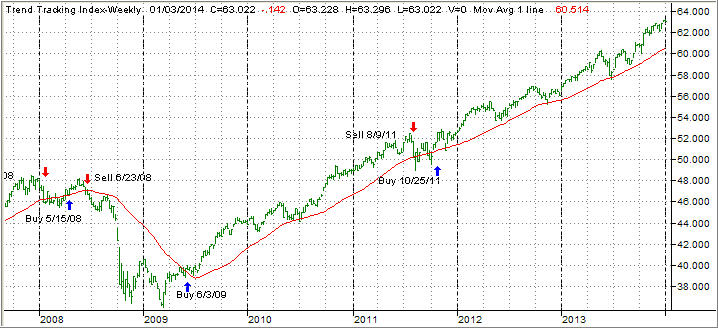
3. Domestic Trend Tracking Indexes (TTIs)

Looking at the big picture, our Trend Tracking Indexes (TTIs) slipped from last week’s high but remain above their long term trend lines by the following percentages:

Domestic TTI: +4.09% (last Friday +4.58%)

International TTI: +6.20% (last Friday +7.05%)

Have a great week.

Ulli…

Disclosure: I am obliged to inform you that I, as well as advisory clients of mine, own some of these listed ETFs. Furthermore, they do not represent a specific investment recommendation for you, they merely show which ETFs from the universe I track are falling within the guidelines specified.

————————————————————-

READER Q & A FOR THE WEEK

All Reader Q & A’s are listed at our web site!
Check it out at:

http://www.successful-investment.com/q&a.php

A note from reader Don:

Q: Ulli: I have been using a 7% sell stop which you have recommended, or used, in the past.  Lately I have noticed you talk about a 7.5% sell stop.  Have you changed your sell stop to 7.5%?

A: Don: The 7% level has been my alert point, but I always have executed once the 7.5% level was crossed.

To avoid confusion, I have used the 7.5% level in my back tests as described in the e-book. Please realize that this is not an exact science and some investors sell even before the 7% level is reached while others use 8%. It all depends on their risk tolerance. The main idea is to have some kind of an exit strategy to avoid participating in the major market downturns.

———————————————————-

WOULD YOU LIKE TO HAVE YOUR INVESTMENTS PROFESSIONALLY MANAGED?

Do you have the time to follow our investment plans yourself? If you are a busy professional who would like to have his portfolio managed using our methodology, please contact me directly or get more details at:

https://theetfbully.com/personal-investment-management/

———————————————————

Back issues of the ETF/No Load Fund Tracker are available on the web at:

https://theetfbully.com/newsletter-archives/

ETF/No Load Fund Tracker Newsletter For Friday, January 3, 2014

Ulli ETF Tracker Contact

ETF/No Load Fund Tracker StatSheet

————————————————————-

THE LINK TO OUR CURRENT ETF/MUTUAL FUND STATSHEET IS:

https://theetfbully.com/2014/01/weekly-statsheet-for-the-etfno-load-fund-tracker-newsletter-updated-through-01022014/

————————————————————

Market Commentary

Friday, January 3, 2014

A CHOPPY WEEK ON WALL STREET

Fri pic

[Chart courtesy of MarketWatch.com]

1. Moving The Markets

Overall, volumes on Wall Street were thin this week, with many traders still on vacation. Also, a major storm in the Northeast hampered travel and states of emergency were declared in New York and New Jersey.

U.S. stocks ended a choppy trading session mostly lower on Friday after Federal Reserve Chairman Ben Bernanke defended the extraordinary measures undertaken by the central bank to boost the economic recovery. The S&P 500 (SPX) slipped less than a point leaving it down 0.6% for the week. The Dow Jones Industrial Average (DJIA) closed up 0.2% but finished the week marginally lower and the tech-heavy Nasdaq Composite (COMP) shed 0.3% on Friday and lost 0.8% for the week.

In the ETF world, WisdomTree, an exchange-traded fund sponsor and asset manager, has announced the launch of the WisdomTree Bloomberg US Dollar Bullish ETF (USDU). The fund, which is linked to the Bloomberg Dollar Total Return Index, seeks to provide exposure to the US dollar against a broad basket of developed and emerging market currencies based on global trade flows and liquidity measures. The nascent actively managed ETF space is just beginning to expand, and you should expect more options as money managers try to edge into mutual fund territory with a cheaper investment wrapper.

As we continue on into 2014, you will most likely see more actively managed ETFs that cover target income, commodities, emerging markets, managed futures, hedged products and other alternatives.

Our 10 ETFs in the Spotlight came off their highs to varying degrees but all remain on the bullish side of their respective trend lines.

Read More

Weekly StatSheet For The ETF/No Load Fund Tracker Newsletter – Updated Through 01/02/2014

Ulli ETF StatSheet Contact

ETF/Mutual Fund Data updated through Thursday, January 2, 2014

Table of Content082312

If you are not familiar with some of the terminology used, please see the Glossary of Terms.


1. DOMESTIC EQUITY MUTUAL FUNDS/ETFs: BUY — since 10/25/2011

TTI010214

Our main directional indicator, the Domestic Trend Tracking Index (TTI), broke through its long-term trend line generating a Sell for this area effective 8/9/2011. Over the recent past, we’ve seen the TTI hovering slightly below and above this dividing line between bullish and bearish territory. The clear break to the upside occurred on 10/24/11 and, effective 10/25/11, a new Buy signal for domestic equities went into effect.

As of today, our Trend Tracking Index (TTI—green line in above chart) has bounced off its long term trend line (red) by +4.34% after briefly dipping below it late in June 2013.

To avoid a potential whip-saw, a Sell signal to move out of all domestic equity positions will be generated once we have clearly pierced the line to the downside. Be sure to tune in for the latest updates.

Read More