Markets Remain Bumpy; FB Makes Another Acquisition

Ulli Market Commentary Contact

Tue pic

[Chart courtesy of MarketWatch.com]

1. Moving The Markets

Equities bounced back today from a previous two day decline. Investors reacted well to a favorable reading on consumer confidence that showed positive signs of growth for the U.S. economy. All of the major indexes gained as the chart above shows. Additionally, nine of the ten industry groups in the S&P 500 ended the day higher. Industrial stocks rose the most, 0.9%, followed by the energy and health care sectors, which each gained 0.8%.

In tech news, Facebook (FB) announced today that it has agreed to buy Oculus, a virtual reality technology company, for $2 billion. Facebook Inc. said that the deal includes $400 million in cash and 23.1 million shares worth about $1.6 billion. Facebook’s stock ended the day up 1.23%. Oculus employees are also eligible for an additional $300 million if the company achieves certain targets. Oculus makes the Oculus Rift, a virtual reality headset that’s received a lot of attention from video game developers, though it’s yet to be released.

The market has been alternating between gains and losses for the most of the month, with investors buying back stocks after every dip. While some are confident that economic growth will accelerate following an unusually harsh winter, others are reluctant to push stock prices too much higher before seeing more clear-cut evidence that the economy is picking up. To avoid not having to play the guessing game, we will simply continue to follow the long-term trends; after all, they appear to be the only true measure as to the direction of equities.

While the consumer confidence report was favorable, I also heard today that fewer people bought new homes in February and that home sales fell to the slowest pace in five months.

Our 10 ETFs in the Spotlight headed north with 7 of them remaining on the plus side YTD.

Read More

Stocks Start The Week On A Down Note; Tech And Healthcare To Blame

Ulli Market Commentary Contact

Mon pic

[Chart courtesy of MarketWatch.com]

1. Moving The Markets

U.S. stocks took a tumble today, with the Nasdaq realizing its biggest daily percentage drop since early February, as some of the market’s recent best performers like technology and biotech shares led the way down. Weakness in the health care sector (XLV) also dragged the U.S. stock market lower. Pharmaceuticals got spanked again, and we got stopped out of our holdings in PJP as its momentum weakend considerably over the past 30 days.

The S&P 500 index fell 0.5%, the Dow lost 0.2% and the tech focused Nasdaq composite fell 1.2%. Almost 80 percent of the stocks traded on the Nasdaq were lower, while about two-thirds of New York Stock Exchange-listed shares fell. Eight of the 10 S&P 500 sectors slid for the day.

In stocks, Netflix, Inc. (NFLX) dropped $6.67 to $378.90 on potential competition from Apple Inc. (AAPL). The Wall Street Journal reported that the iPhone and iPad maker is in talks with Comcast Corporation (CMCSA) to release a TV set-top box. The stock price of Apple gained 1.19% to $539.19 per share while Comcast rose 0.60% to $50.30 per share today. Herbalife Ltd (HLF) said it would allow three more representatives of billionaire investor Carl Icahn, the company’s biggest shareholder, to join its board. Shares of the nutrition and weight-loss company jumped 7.7 percent to $53.35.

In the latest snapshot of the US economy, financial data firm Markit said its preliminary read on March manufacturing activity slowed after nearing a four-year high last month. Markit, however, said the rate of growth and the pace of hiring remained strong.

Ukraine announced the evacuation of its troops from Crimea, essentially yielding the region to Russian forces, which seized a Ukrainian marine base. While few US companies have excessive exposure to the region, investors are concerned about the potential economic fallout from any escalation in tensions.

Our 10 ETFs in the Spotlight slipped with 7 of them remaining on the plus side YTD.

Read More

ETFs/Mutual Funds On The Cutline – Updated Through 03/21/2014

Ulli ETFs on the Cutline Contact

Below are the latest ETF Cutline reports, which show how far above or below their respective long-term trend lines (39 week SMA) my currently tracked ETFs/MFs are positioned.

The first report covers the ETF Master List from Thursday’s StatSheet and includes 398 ETFs, of which currently 356 (last week 361) are hovering in bullish territory.

The second report includes only High Volume ETFs. To clarify, High Volume (HV) ETFs are defined as those with an average daily volume of $10 million or higher.

These ETFs are generated from my selected list of some 97 that I use in my advisor practice. It cuts out the “noise,” which simply means it eliminates those ETFs that I would never buy because of their volume limitations. 67 ETFs (last week 70) have managed to remain in bullish territory after the recent market volatility.

The third report covers Mutual Funds on the Cutline. There are currently 727 (last week 706) above the line and 122 below it out of the 859 that I follow.

Take a look:

1. ETF Master Cutline Report     

2. ETF High Volume Cutline Report

3. MF Cutline Report

In case you are not familiar with some of the terminology used in the reports, please read the Glossary of Terms.

If you missed the original post about the Cutline approach, you can read it here.

One Man’s Opinion: Will The Fed’s Stress-Test Results Stimulate US Lending?

Ulli Market Review Contact

92835431The latest stress test by the US Fed showed all but one of the 30 largest banks has enough capital to withstand a deep recession. Zions Bancorp was the only lender that came in below the Federal Reserve’s main capital threshold. This is obviously good news for American banks and borrowers, said Frank Keating, President of the American Bankers Association.

In the last five years, US banks have doubled their capital, which helped them pass this extreme test. For the first time in history, 30 of the largest banks were measured and 29 made the mark, which is good news for the US banking system, he said.

Asked if the current capital levels could be lowered to enable the banks to lend more, Frank said the Fed is supposed to run these tests every year anyway. The tests include extreme scenarios like a 50 percent collapse in stock markets and housing price levels slumping to 2001 levels, which may or may not take place in near future.

Read More

New ETFs On The Block: Advisorshares Yieldpro ETF (YPRO)

Ulli Dividend ETFs Contact

71030972AdvisorShares, the Bethesda, Maryland-based issuer better known for its offerings in actively-managed exchange-traded funds, has expanded its portfolio range with the launch of the AdvisorShares YieldPro ETF (YPRO).

The new fund provides investors a new play in the high yield space while controlling volatility. California-based investment advisory firm The Elements Financial Group LLC, which is also advisor for the AdvisorShares EquityPro ETF (EPRO), will be managing the new fund.

YPRO is a “fund of funds” and aims to achieve attractive current yield and capital appreciation by allocating majority of the portfolio to both long and short investments across the entire fixed-income market spectrum.

Read More

03-21-2014

Ulli Newsletter Archives Contact

ETF/No Load Fund Tracker Newsletter For March 21, 2014

ETF/No Load Fund Tracker StatSheet

————————————————————-

THE LINK TO OUR CURRENT ETF/MUTUAL FUND STATSHEET IS:

https://theetfbully.com/2014/03/weekly-statsheet-for-the-etfno-load-fund-tracker-newsletter-updated-through-03202014/

————————————————————

Market Commentary

Friday, March 21, 2014

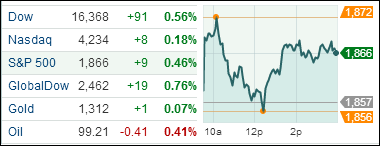
EQUITY INDEXES LOSE STEAM BUT GAIN FOR THE WEEK

Fri pic

[Chart courtesy of MarketWatch.com]

1. Moving The Markets

Equities were bouncing back this week but metals aren’t keeping up. More important is Janet Yellen’s statement indicating that interest rates could rise sooner than expected. The unemployment rate, though manipulated, is still higher than what the FED would regard as ‘full employment.’

The big news item for the week was Wednesday’s announcement by newly appointed Federal Reserve chair Janet Yellen indicating that interest rates could go up sooner than previously expected. While Wall Street had been anticipating the Fed to raise rates for quite some time, the ambiguous manner in which Yellen addressed the issue sent stocks and bonds tumbling. Adding to the vagueness were other mitigating factors that could play into the Fed’s decision making process, namely the unemployment rate which currently stands at 6.7 percent, well above the 5.2 to 5.6 percent range Fed officials see as in keeping with full employment.

Domestic markets aren’t quite in the same Q1 stride as we experienced in 2013. In the first quarter 2013, advancing days exceeded declining days by nearly 61%. For 2014, that ratio is down to 16%, and with only 7 more sessions remaining for the current quarter, there’s not much room for improvement. That means it’s important to have your sell stop discipline in place in case momentum goes the other way, and the markets decide to head south.

Geopolitical issues remained in focus this week after President Vladimir V. Putin signed laws completing Russia’s annexation of Crimea and investors were unnerved by a decision by the United States to slap sanctions on his inner circle. Russia’s MICEX stock index was down 1 percent.

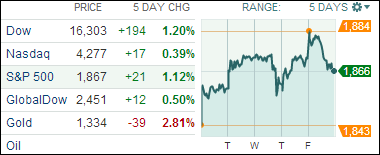
Gold and the rest of the precious metals complex has been taking some hard hits this week, scaring off would-be investors from diverting capital into the traditional safe-haven asset. While the yellow metal is down below a key support level of $1,350, it is also up 9% for the quarter, a performance that is 6-times that of the aforementioned large-cap equities sector.

Our 10 ETFs in the Spotlight edged higher with 1 of them making a new high today while 7 of them are remaining on the plus side YTD.

2. ETFs in the Spotlight

In case you missed the announcement and description of this section, you can read it here again.

It features 10 broadly diversified ETFs from my HighVolume list as posted every Monday. Furthermore, they are screened for the lowest MaxDD% number meaning they have been showing better resistance to temporary sell offs than all others over the past year.

In other words, none of them ever triggered their 7.5% sell stop level during this time period, which included a variety of severe market pullbacks but no move into outright bear market territory.

Here are the 10 candidates:

MaxDD

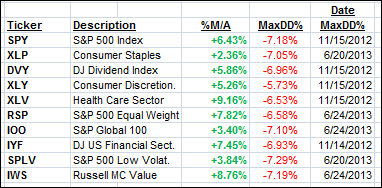
All of them are in “buy” mode meaning their prices are above their respective long term trend lines by the percentage indicated (%M/A).

Year to date, here’s how the above candidates have fared so far:

YTD

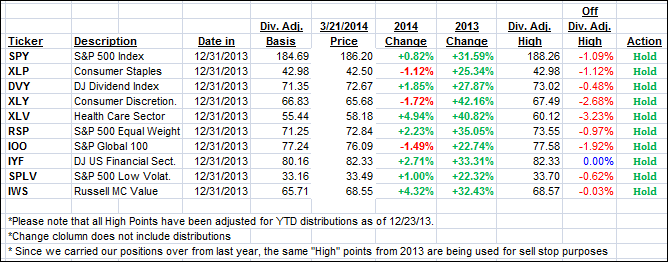
To be clear, the first table above shows the position of the various ETFs in relation to their respective long term trend lines (%M/A), while the second one tracks their trailing sell stops in the “Off High” column.

3. Domestic Trend Tracking Indexes (TTIs)

Our Trend Tracking Indexes (TTIs) slipped and ended the week as follows:

Domestic TTI: +3.24% (last Friday +3.34%)

International TTI: +2.96% (last Friday +3.10%)

Have a great week.

Ulli…

Disclosure: I am obliged to inform you that I, as well as advisory clients of mine, own some of these listed ETFs. Furthermore, they do not represent a specific investment recommendation for you, they merely show which ETFs from the universe I track are falling within the guidelines specified.

————————————————————-

READER Q & A FOR THE WEEK

All Reader Q & A’s are listed at our web site!
Check it out at:

http://www.successful-investment.com/q&a.php

A note from reader Duffy:

Q: Ulli: Regarding %M/A is there a % that is higher than you are comfortable with, i.e. XLV is 11.89% above its trend line, so would one think it would come down some, to an average % range above the trend. In other words, is there more risk (even though it is a buy) the higher the (%m/a) is? Do some of these ETFs have a range they are usually above the trend line?

A: Duffy: The %M/A shows me how strong the upward momentum is for a fund like XLV (which I own) compared to others. Strong momentum also means that this ETF has risen higher above its long term trend line than most of the other ETFs in the Spotlight. There is no average range that I have found that might give you a better entry point.

So, if you enter now, apply the trailing sell stop discipline rather than waiting for XLV to break below its long-term trend line. If the markets head south, and take XLV with it, I would sell it after it has come 7.5% off its high, as shown in the daily update. That gives me a better handle on controlling downside risk.

———————————————————-

WOULD YOU LIKE TO HAVE YOUR INVESTMENTS PROFESSIONALLY MANAGED?

Do you have the time to follow our investment plans yourself? If you are a busy professional who would like to have his portfolio managed using our methodology, please contact me directly or get more details at:

https://theetfbully.com/personal-investment-management/

———————————————————

Back issues of the ETF/No Load Fund Tracker are available on the web at:

https://theetfbully.com/newsletter-archives/