
1. Moving The Markets
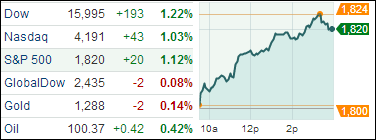
Equities performed well across the board today, with all 10 S&P 500 sectors closing the day with gains. Markets seemed to react positive to the news that Congress has finally agreed to advance legislation that will extend U.S. borrowing authority. Republican leaders in the House caved to President Obama’s demands to suspend the U.S. debt limit until March 2015 without conditions.
Now that we have received some clarity from Janet Yellen that the Fed plans on keeping short-term interest rates low, we can turn our attention back to gold and silver for the moment. Yellen basically told us that the Fed isn’t going to move on short-term rates until its preferred annual inflation measure moves to 2.5 percent versus its current rate of 1.1 percent.
It’s worth noting that this measure, which measures the rate of inflation on core personal consumption expenditures, hasn’t hit 2.5 percent since January 2012. So it could be a while before we see short-term rates reach higher levels.
Our 10 ETFs in the Spotlight rallied with the indexes with all of them now hovering above their respective trend lines and one of them actually made new highs for the year as the tables below show.
2. ETFs in the Spotlight
In case you missed the announcement and description of this section, you can read it here again.
It features 10 broadly diversified ETFs from my HighVolume list as posted every Monday. Furthermore, they are screened for the lowest MaxDD% number meaning they have been showing better resistance to temporary sell offs than all others over the past year.
In other words, none of them ever triggered their 7.5% sell stop level during this time period, which included a variety of severe market pullbacks but no move into outright bear market territory.
Here are the 10 candidates:
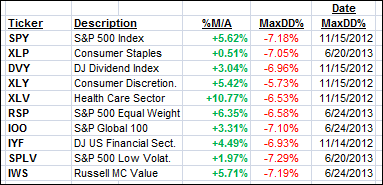
All of them have moved back into “buy” mode after this recent market hiccup meaning their prices are above their respective long term trend lines by the percentage indicated (%M/A).
Year to date, here’s how the above candidates have fared so far:
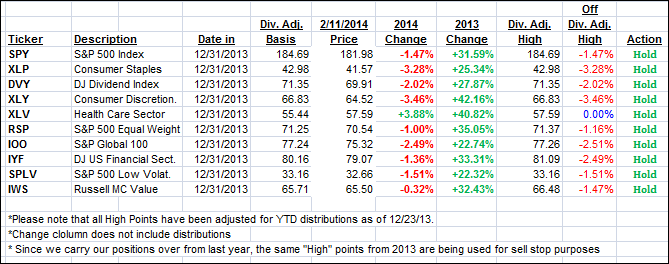
To be clear, the first table above shows the position of the various ETFs in relation to their respective long term trend lines (%M/A), while the second one tracks their trailing sell stops in the “Off High” column.
3. Domestic Trend Tracking Indexes (TTIs)
Our Trend Tracking Indexes (TTIs) joined the rally and closed higher:
Domestic TTI: +3.00% (last close +2.63%)
International TTI: +5.14% (last close +4.16%)
Contact Ulli